Alerting system configuration in Grafana
- The best way to understand the new alerting system is to watch this webinar from the Grafana team: https://grafana.com/go/webinar/intro-to-unified-alerting-in-grafana/
Setting up Contact Points
On the left side of the home page, click the bell icon circled in red.
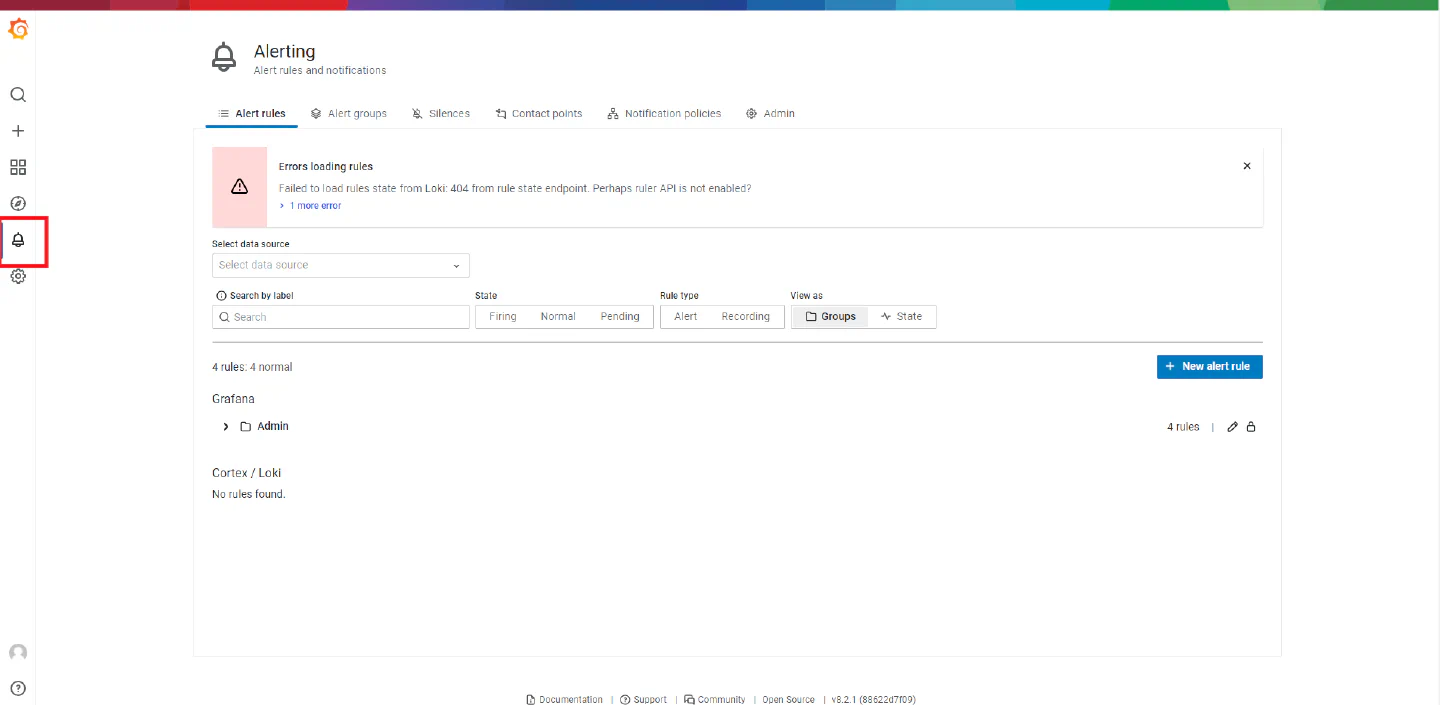
First, in order to get alerts working, we need to set up a point of contact for the alert.
- The default contact point name is “grafana-default-email”
- You can edit this contact point, and simply add any email you want.
- Any alerts you create will be sent to these emails by default unless you change the “Notification Policies.”
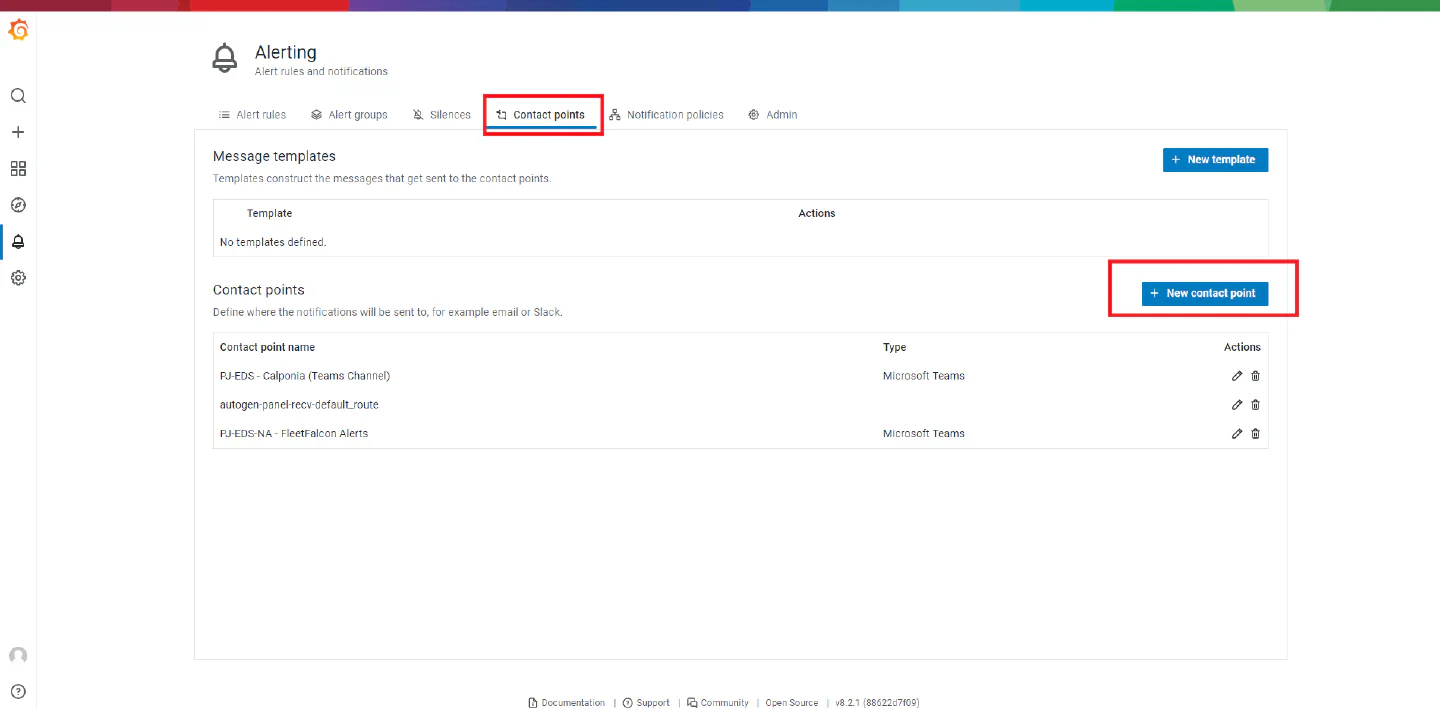
- There are other available contact point options within Grafana, however, we are going to focus on setting up a special Microsoft teams alert channel.
- Go to the contacts point, and click the blue “+ New Contact Point” button.
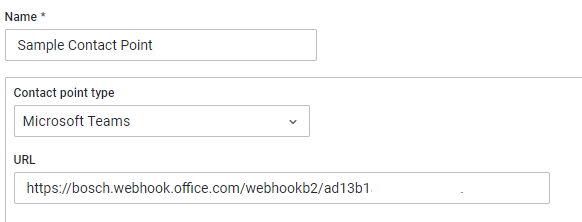
Now enter your desired name for this configuration and change the contact point to what program you want to use (in our case Microsoft Teams).
- For the URL, you will need to get the custom Webhook URL for the teams channel you want the alerts to go to.
- You can do this by going to your microsoft teams app and following the instructions below.
Microsoft Teams Integration
First, make sure you are inside the team where you want to have an alert channel.
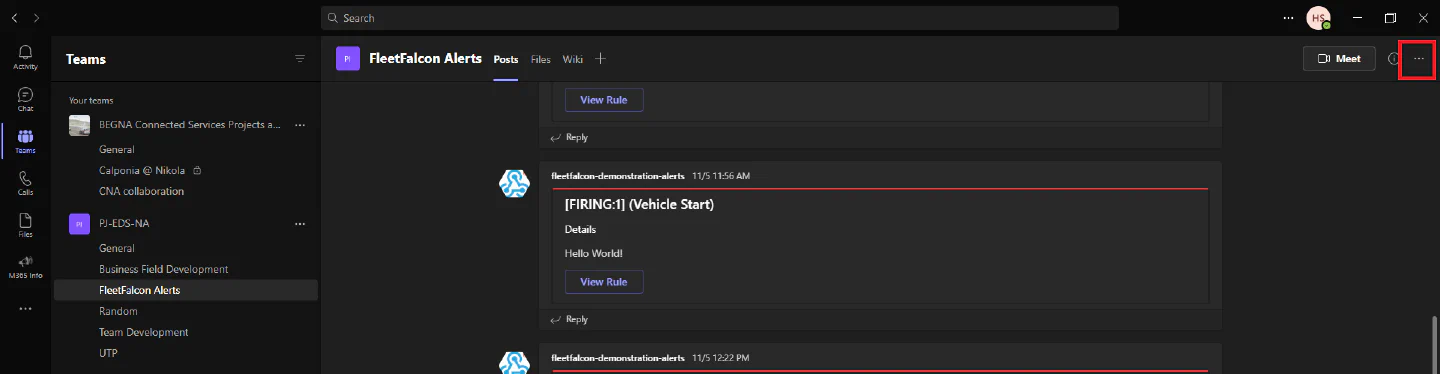
- Click on the three dots in the top right of the app, (Circled in red).
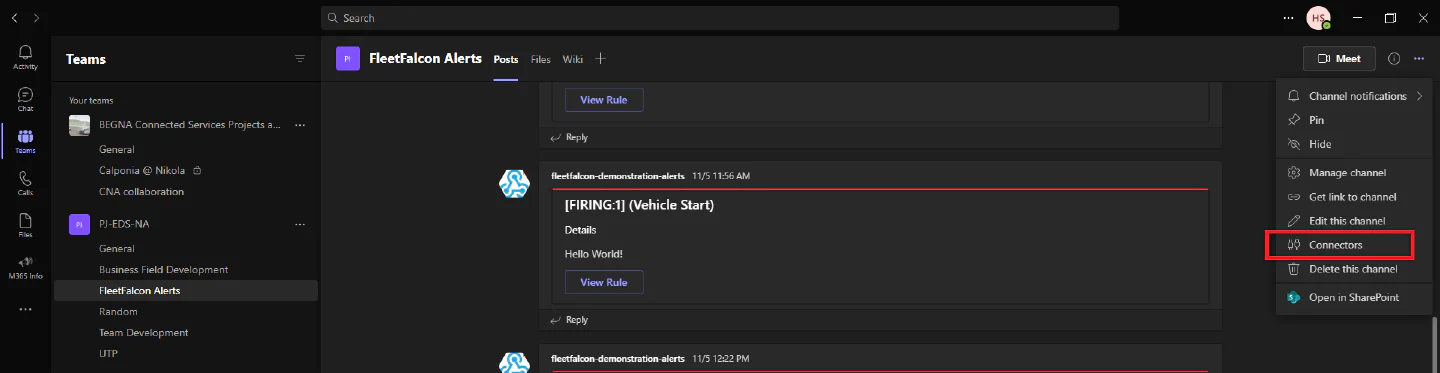
Click on “connections”
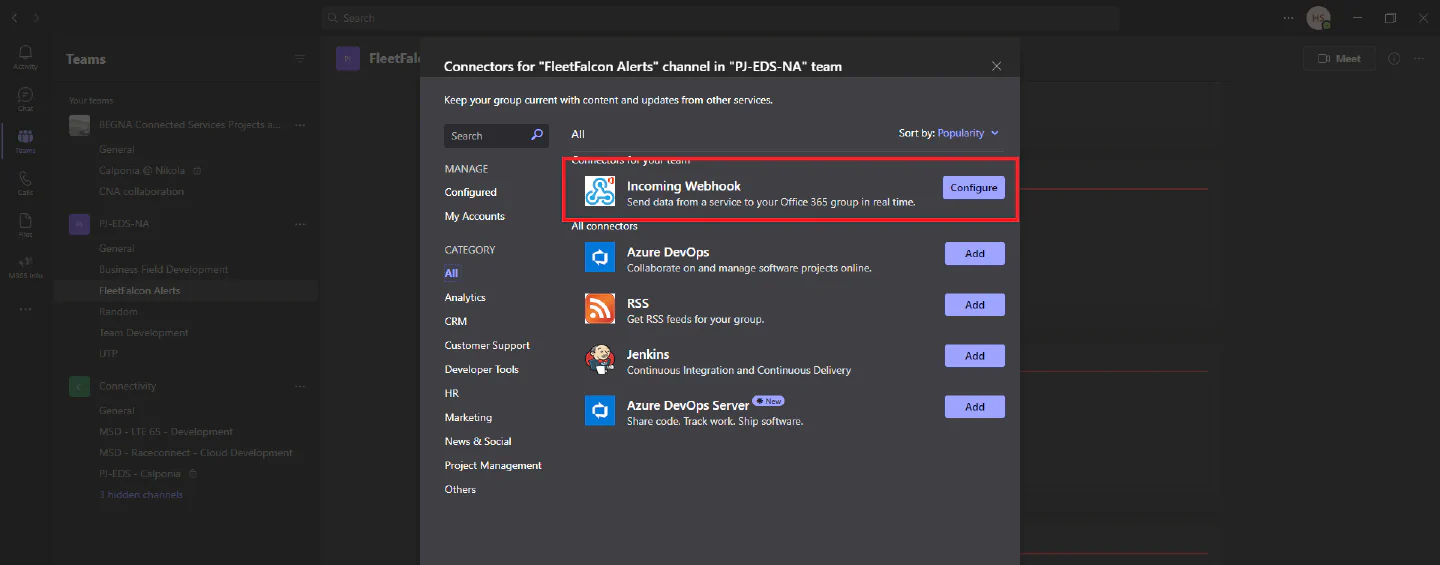
Find “Incoming Webhook” it should be near the top, if not you can search for it using the search bar in the top left.
- Once you find it, click “add.” In the photo it shows “configure” that is only due to the fact that one has already been added in this particular teams.
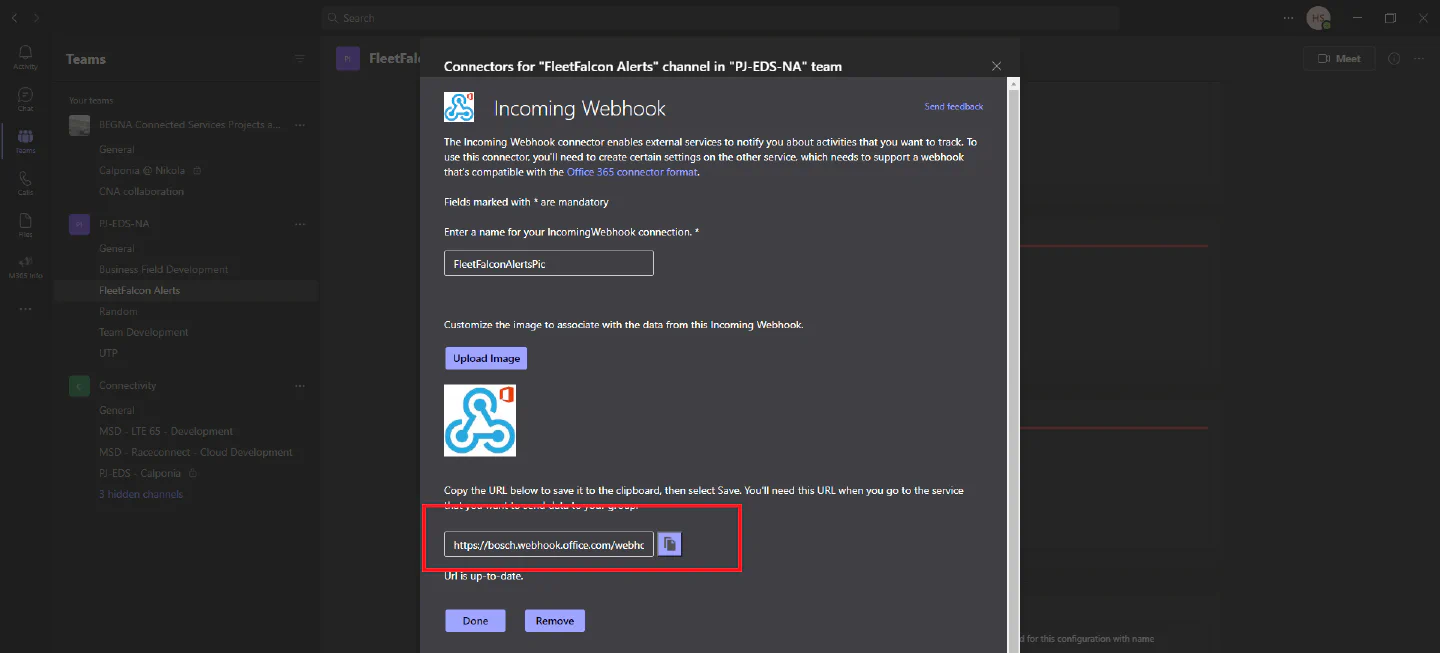
Once you do this, you can name your “Incoming Webhook connection.” You can also Upload a custom image if you desire.
-
Circled in red you will find the URL you originally needed to copy into Grafana’s Contact Point URL box.
-
Once this step is done, you can now go into creating custom alerts based on events that happen on the CAN bus.
Setting up and Creating Custom Alerts
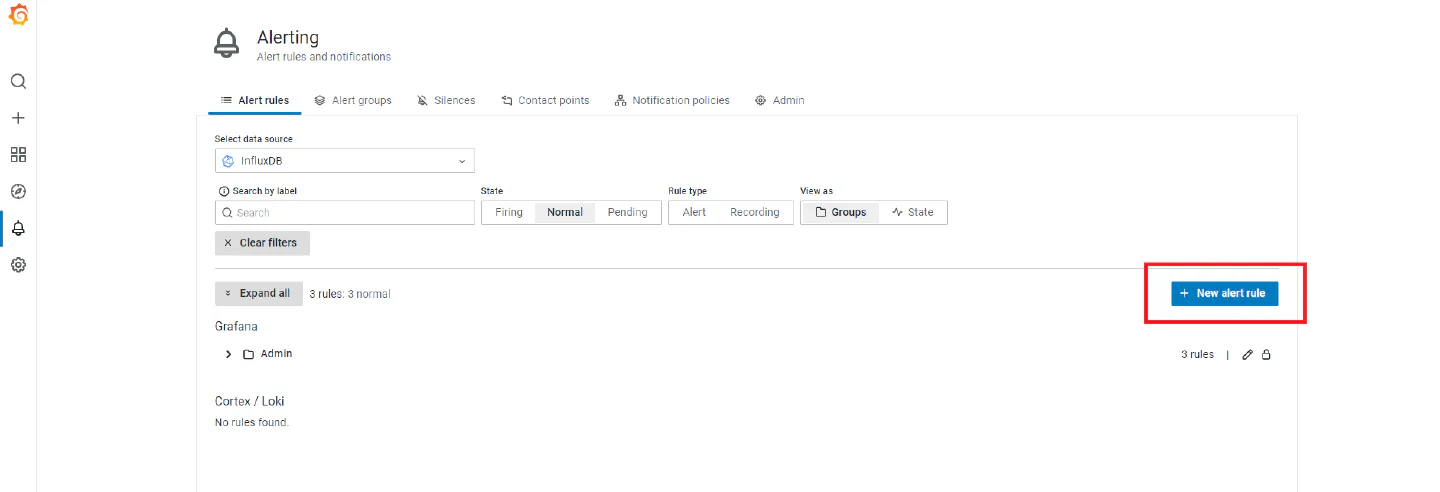
First, in the Alerts section, click on the blue button labeled “New alert rule.”
-
If you have no alerts created, the “New alert rule” will be located at the center of your screen.
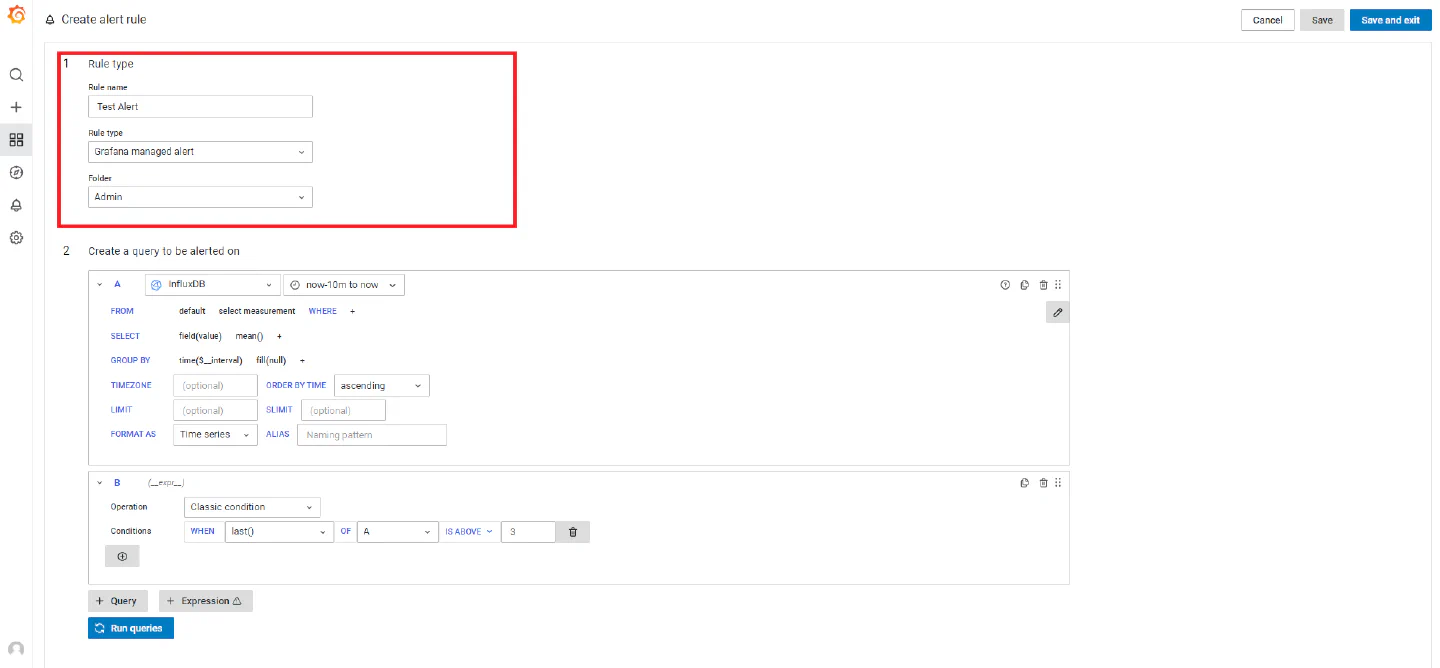
You will be prompted to create your rule name, rule type, and a folder.
- For rule name, choose a name that describes what kind of alert you are creating.
- For rule type, choose “Grafana managed alert.”
- Next select a folder, admin is chosen in this case. If there is no folder you will be prompted to create one.
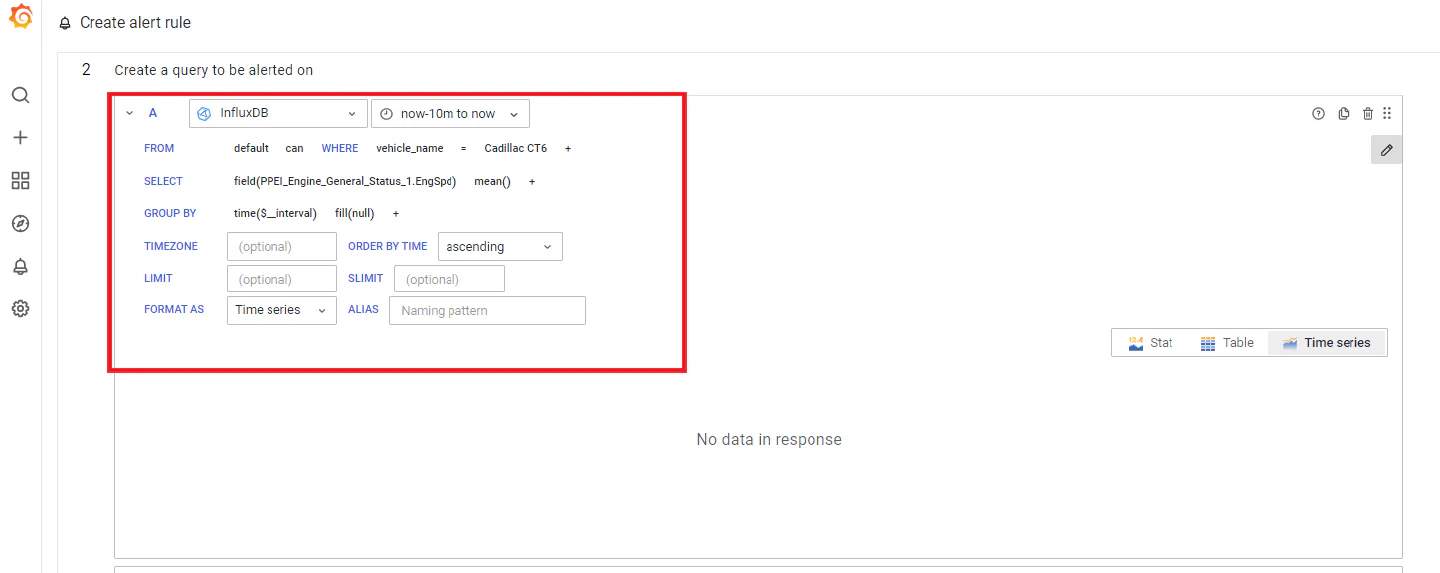
Now you will create the actual alert based on events that happen within the CAN interface.
-
You may select any CAN signal for the vehicle you want to create an alert for. Choosing a CAN signal is done in the same way you choose them when creating your custom Grafana dashboard graphs and charts.
-
For From select “CAN” for where select “vehicle_name” and then choose which vehicle you are working on.
-
Now select your desired CAN signal. Here EngSpd was selected, and we choose to look at the mean of the engine speed.
-
With this selected we can now easily get an alert when the engine is turned on or if EngSpd goes over or under a threshold of your choosing. You can work with many functions, like LAST read, SUM, or COUNT.
We will create a custom expression next step.
For example:
-
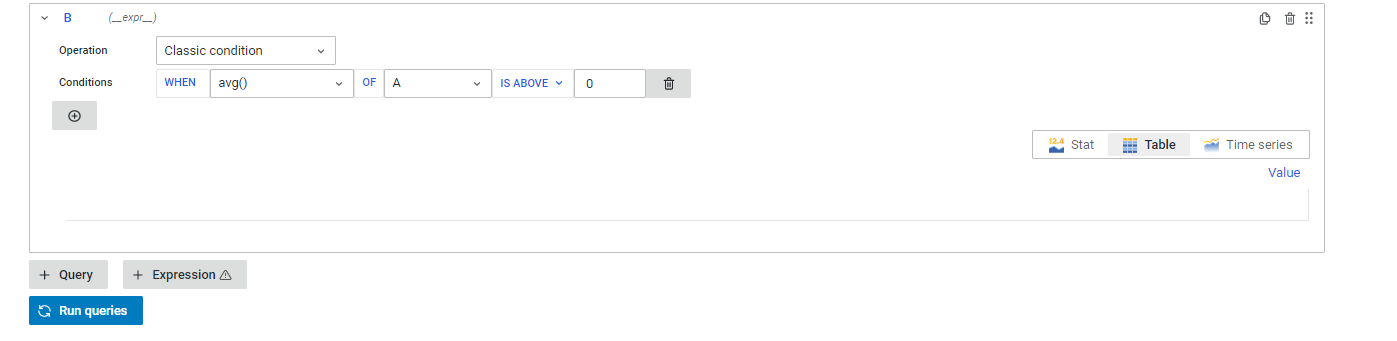
This alert just tells us if the engine turned on by looking at the PPEI_Engine_General_Status_1.EngSpd CAN signal, this can be done in many other ways, the choice is up to you.
-
In the expression, we use a classic condition, and check when the AVG of “A” (the query we created above) is above 0. By doing this whenever the EngSpd is above zero, the alert is triggered.
Here we choose how often to look at the alert conditions.
-
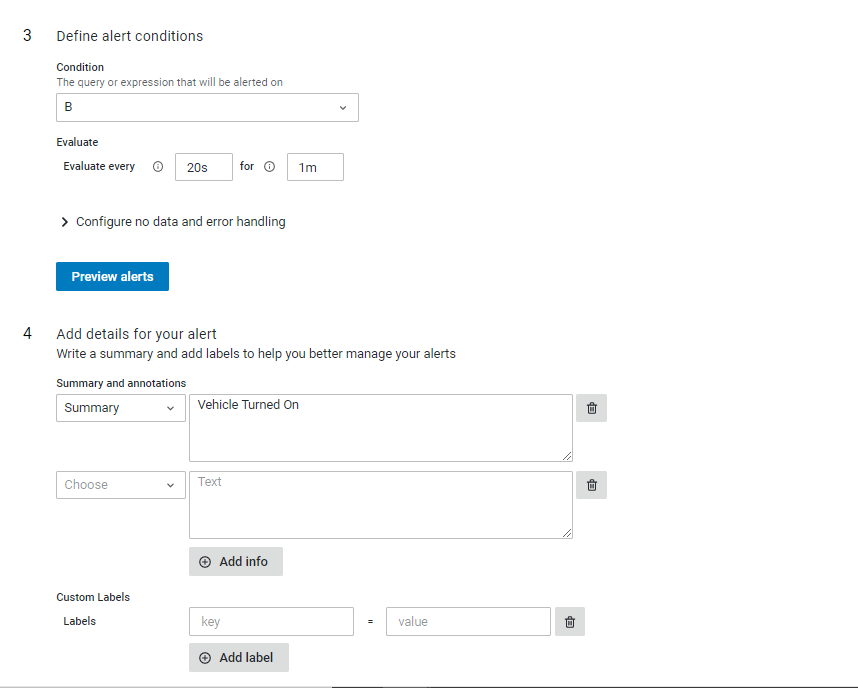
We look at “B” and evaluate every 20s for 1m. These values can be changed, however, the minimum the first value can be is 10s and the second “for” value must always be greater than the first value.
-
Now you can add a description or summary of what you want the Alert to say when its triggered. Here we choose to have the alert in teams read that the “vehicle has turned on.”