1. Working with Dashboards
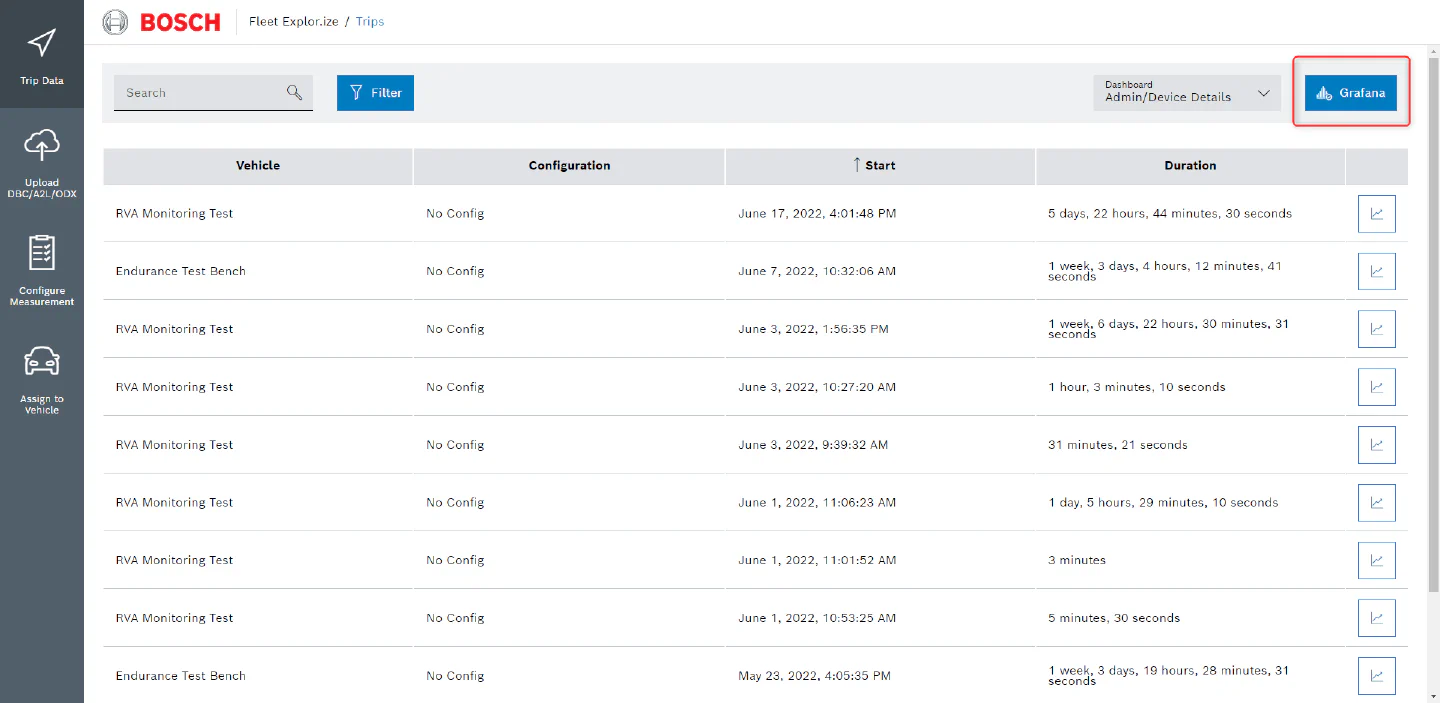
In order to navigate to Grafana (Our visualization tool). Go to the “trips” page and hit the blue “Grafana” button.
2. Navigating to and between Dashboards
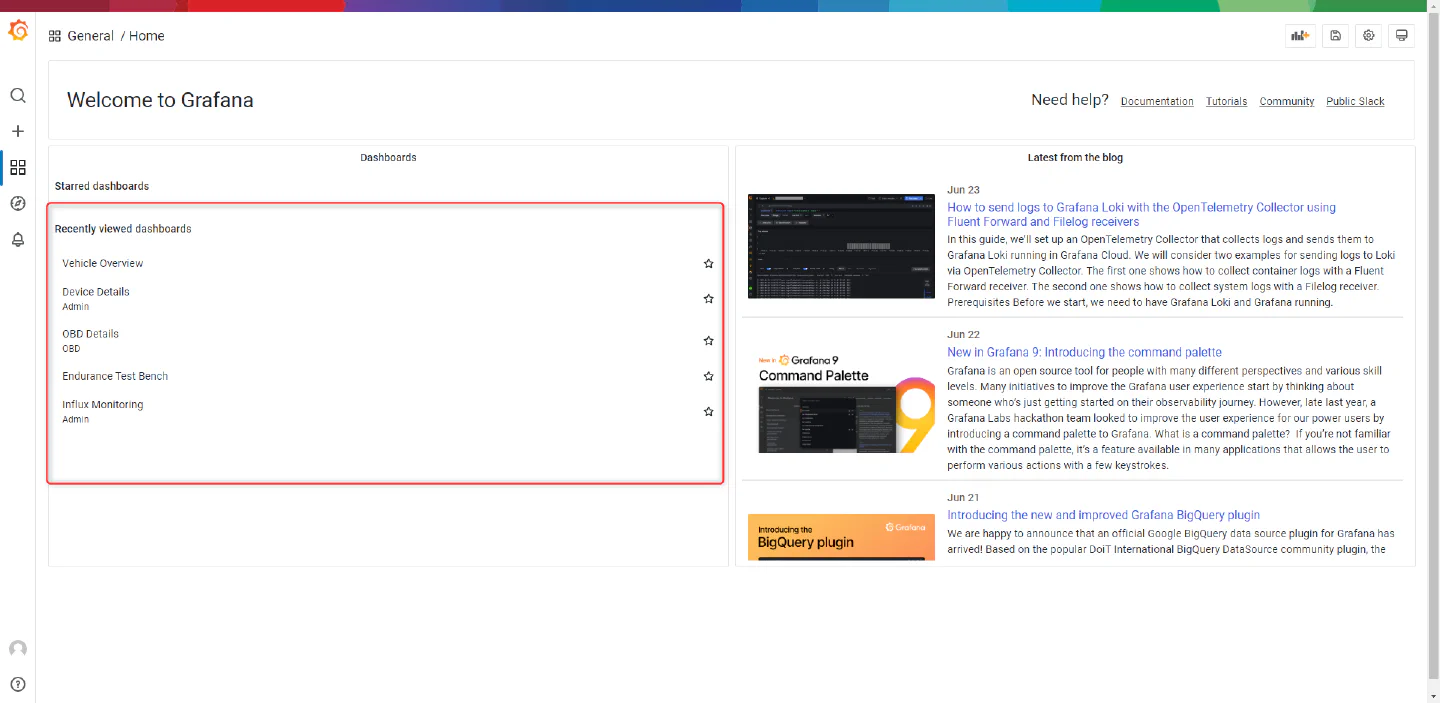
After navigating to Grafana you get to the landing page.
- You can find your recently used dashboards on the left side after scrolling down a bit.
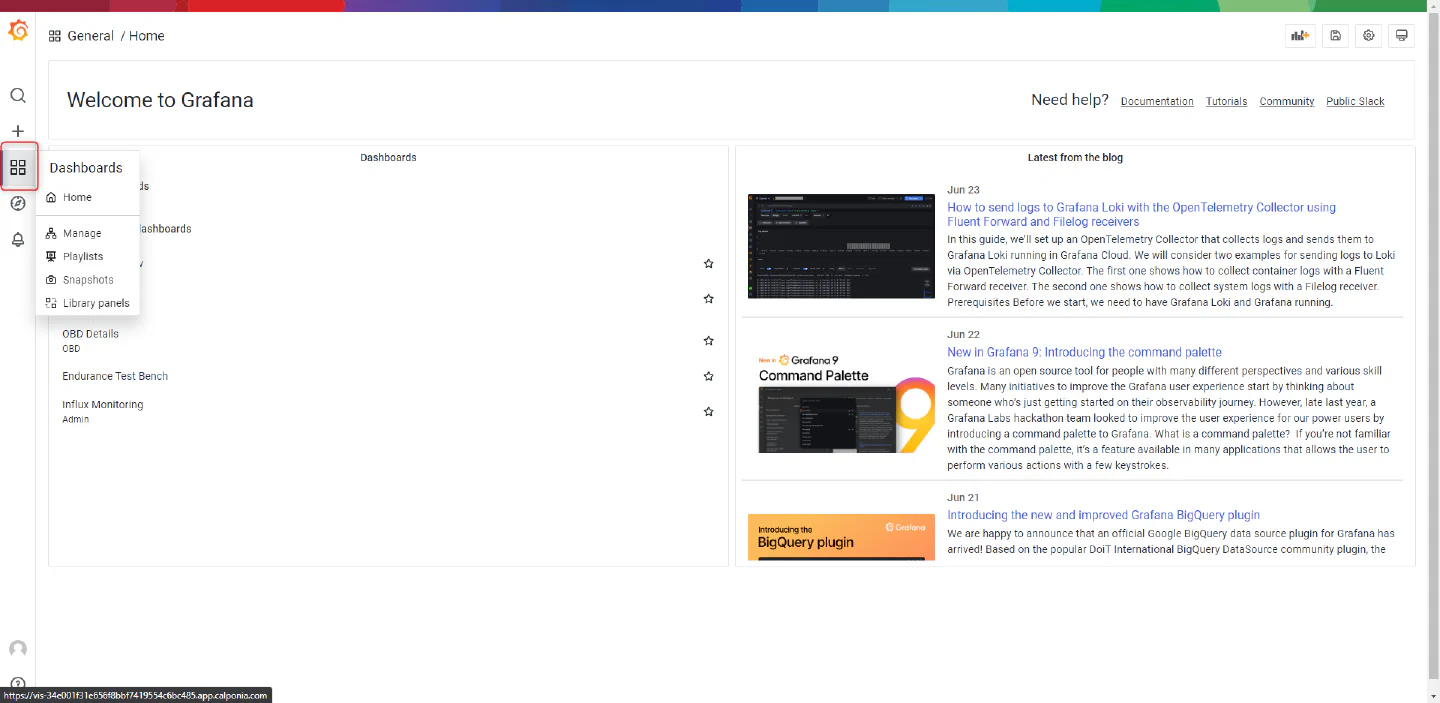
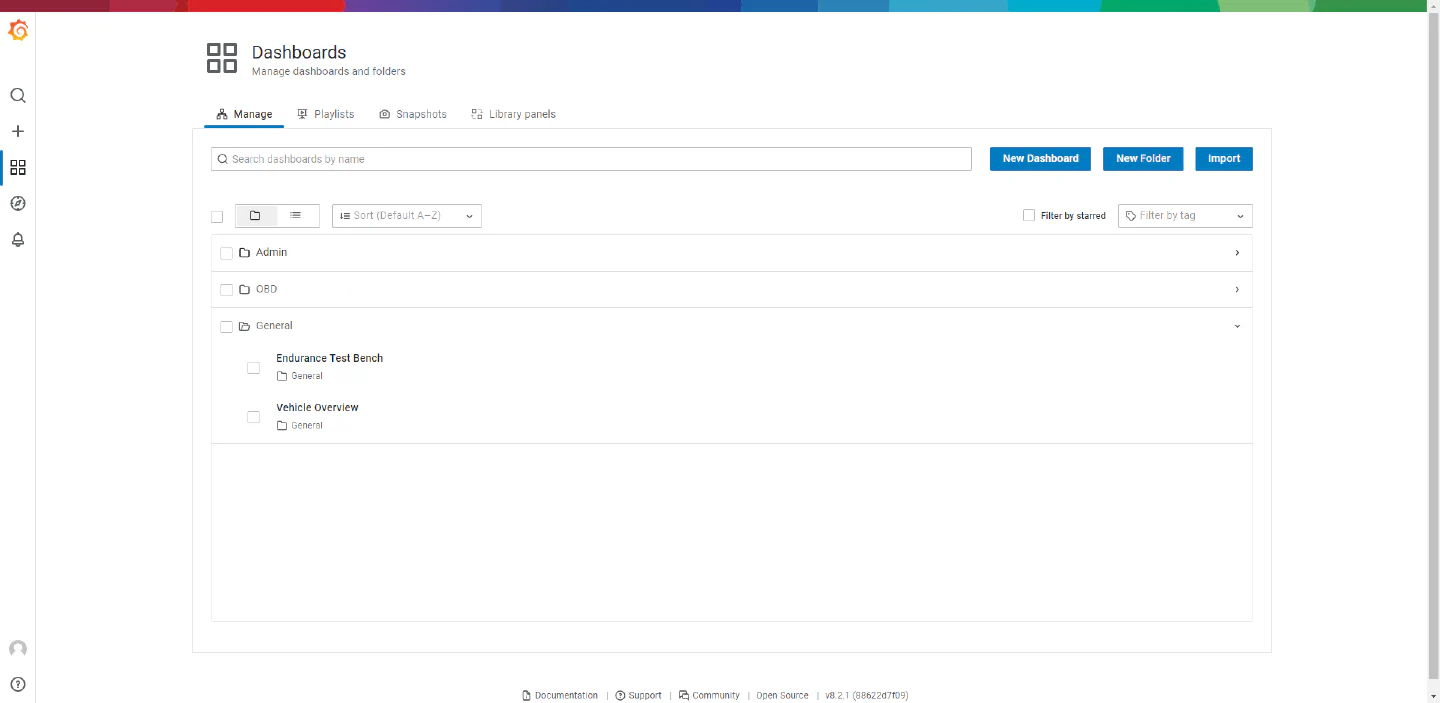
You find all available dashboards by hitting the “four squares” on the left side and then by hitting “Manage”.
There is a folder structure for Dashboards.
- Click on the folders to see the dashboards there or create new folders there as well as new dashboards.
3. Best practices to create a new “time series” panel
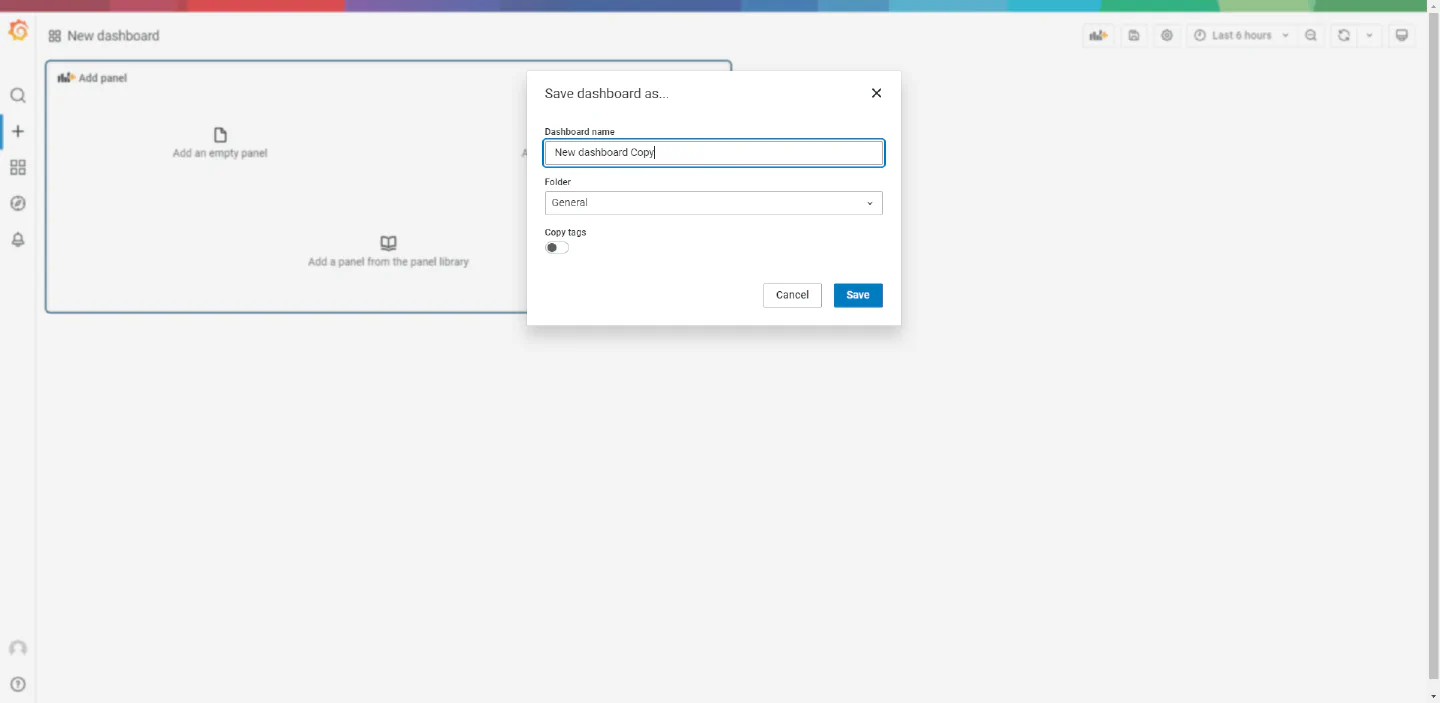
Create a new panel.
- Click “Add panel”.
- Click “Add empty panel” in the new show panel.
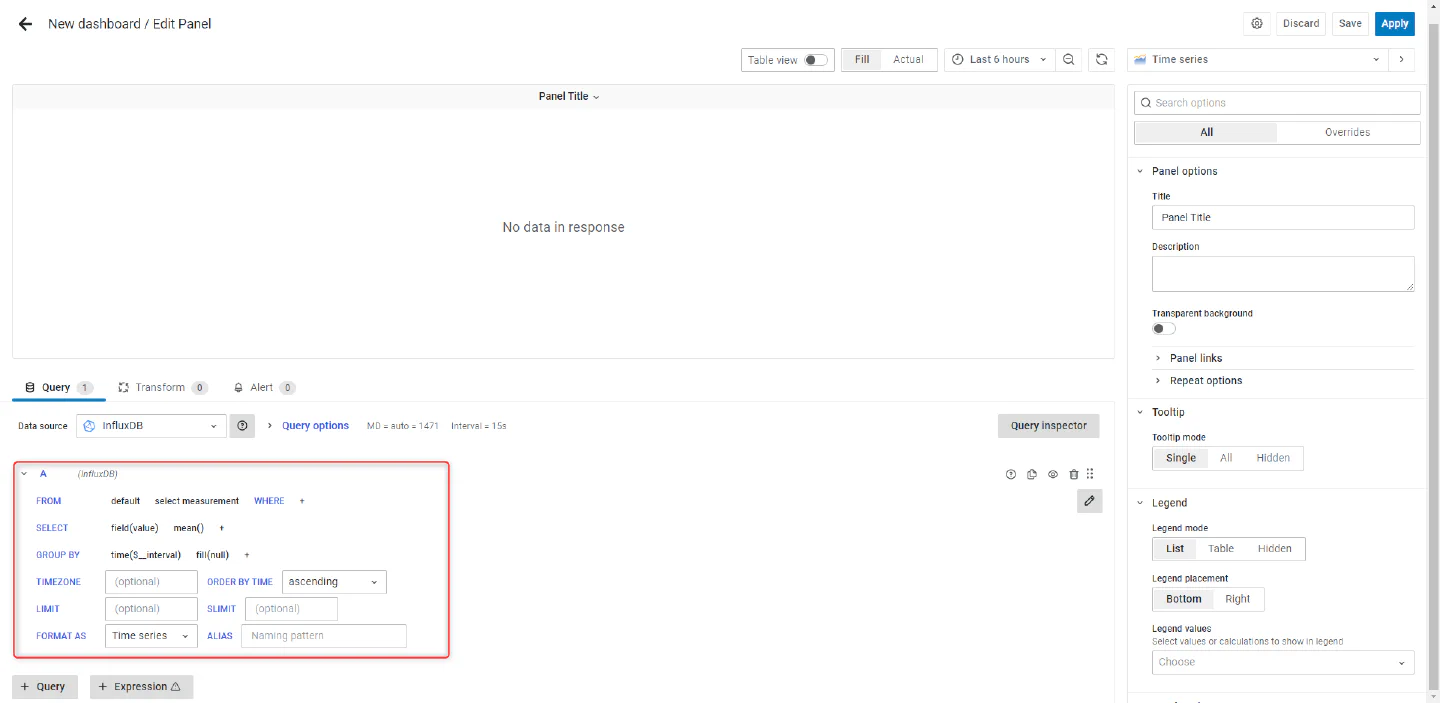
Making your custom query
-
Select the data source.
- Hit “select measurement” and choose your source
- depending on how you collect your data (CAN, XCP, OBDII, UDS, GPS) you will find the according sources there.
- the source “collectd” is there by default and gives the user access to device information of the used connectivity device.
- Hit “select measurement” and choose your source
-
Hit the “+” next to WHERE and choose “vehicle_name”
- select “select_tag_value” and choose a fixed vehicle or “/$vehicle/” (which will always show the data of the current chosen vehicle in the “Vehicle drop-down” menu. (See Create “Vehicle drop-down” menu).
-
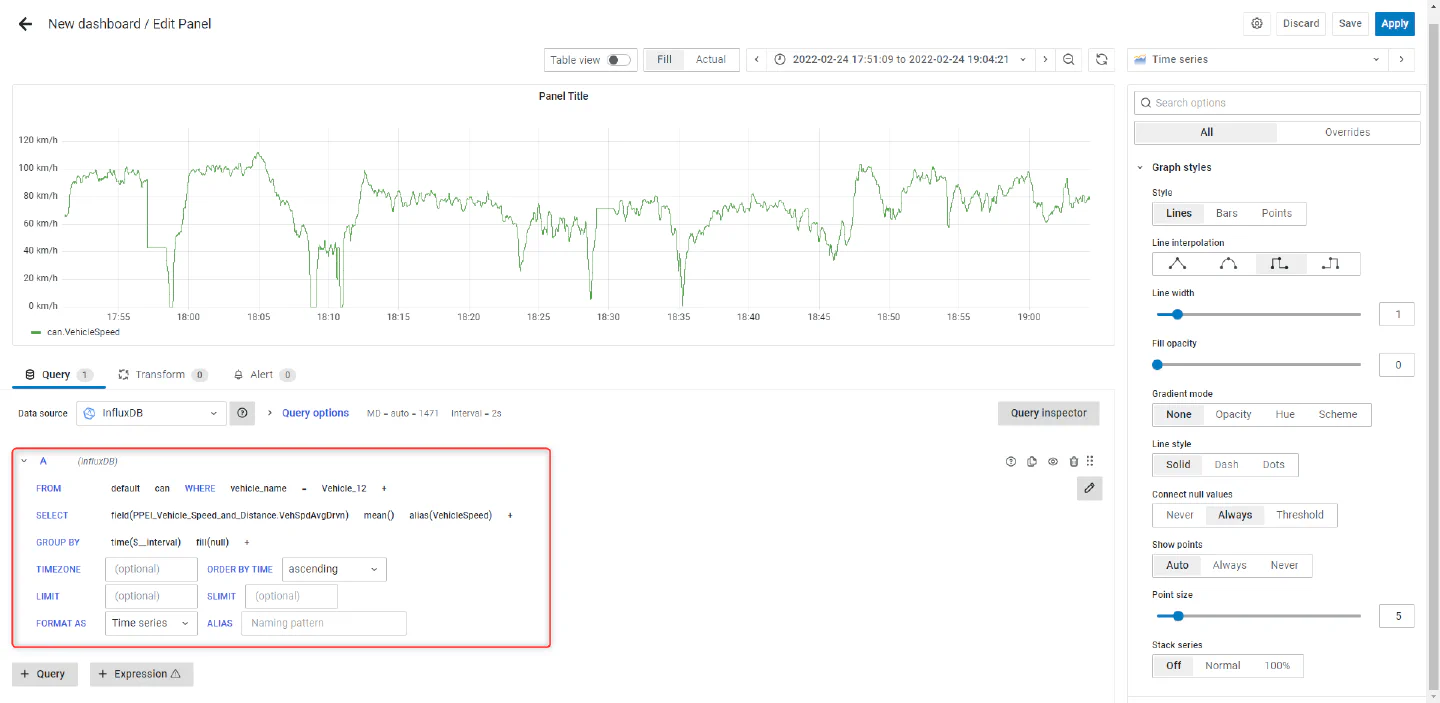
Select signals.
- hit “value” in field(value) and select your signal (all the signals defined in your measurement configuration is here, use the fuzzy search).
- hit “+” on the right side of the “SELECT” row and “Aliasing” - “alias”. Click on “alias” in alias(alias) and enter the signal name you want to use.
Before creating the “query”
After creating the “query”
Adjusting the units of your panel.
- Two options:
- On the right side, scroll down to “Standard options” and choose your “Unit” (use the search function).
- On the right side, hit the “Search options” search bar and enter “unit” to get to the same menu as with option 1.
- Change from “autoscale” to “fixed” axis.
- Similar to changing units. Go to “Standard options” and enter the “Min” and/or “Max” value.
- You can change your “Panel Title” in the “Panel Options”.
- Note: there are many other options you can apply to your panels - this walkthrough is not exhaustive and only provides you with the basics to get you going.
4. Best practices for adding a second signal to a time series panel
Click the “+” icon in the “Select” row.
- From there navigate to the bottom of the list and select “Fields” and then “field”.
- Note: You might need to zoom out your browser to see the whole drop-down list.
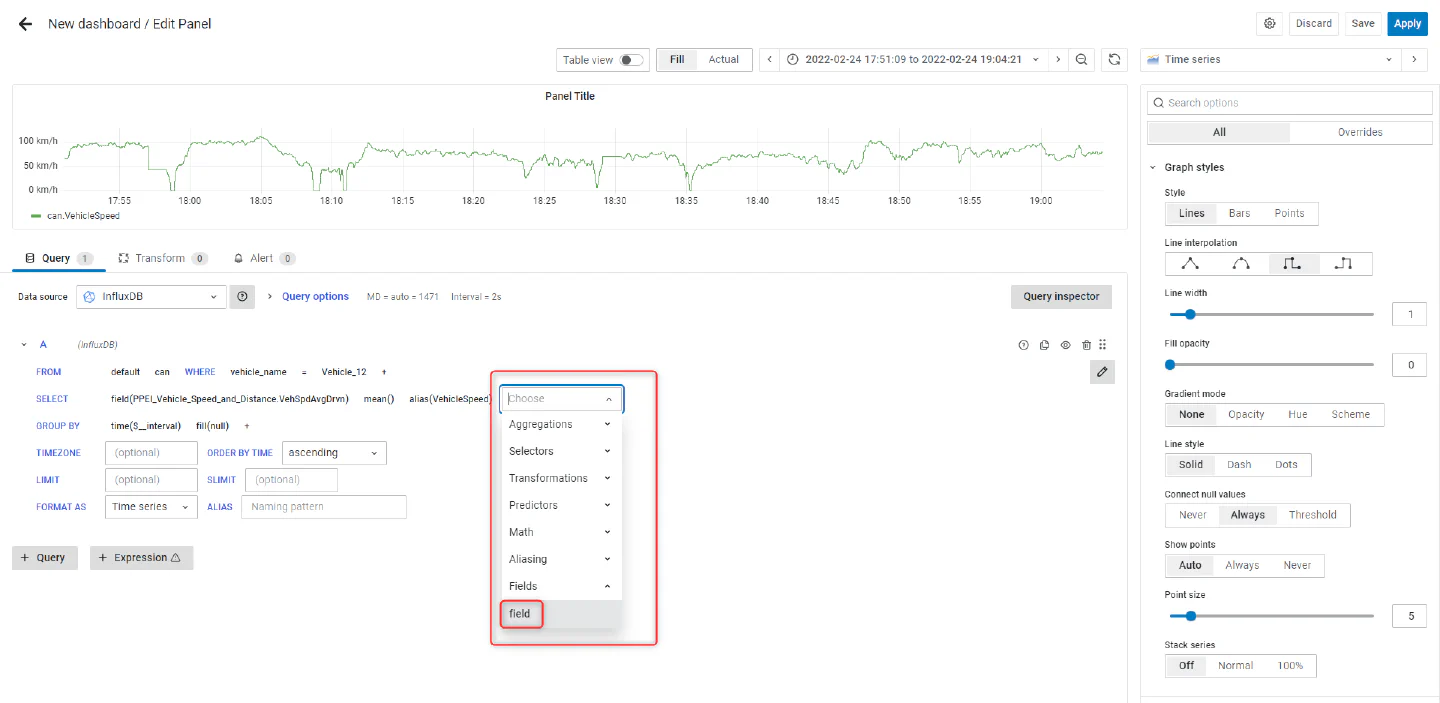
Once you’ve added the second field you can populate the options just as you did for the first signal.
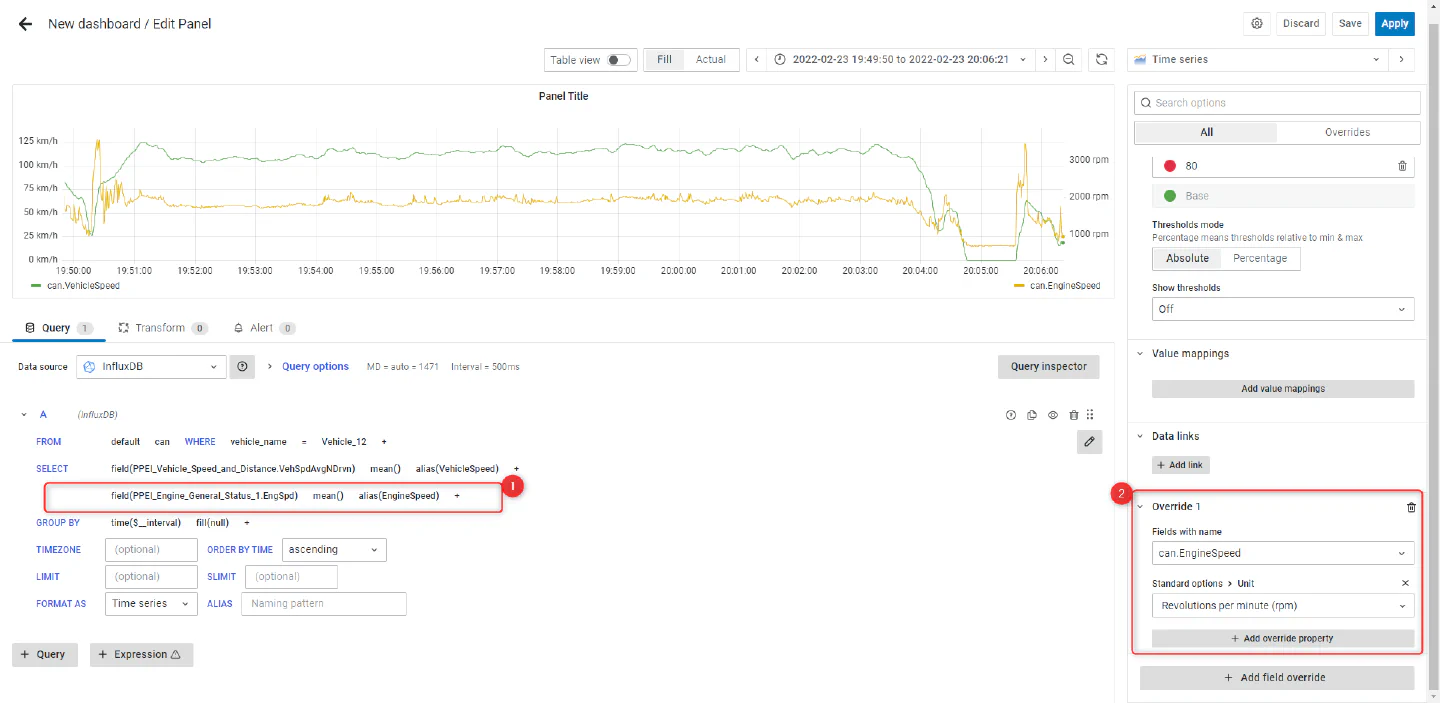
- It’s important to know that if you add multiple fields into one panel, you might have to play with “Field Overrides”.
- For Example to set the the proper units for both fields “VehicleSpeed” and “EngineSpeed” you must set the units seperately in the overrides section as seen below.
5. Creating and using the FF-Map Panel
Start by creating a new panel.
- Hit “Add panel”.

- Hit “Add empty panel” in the new panel
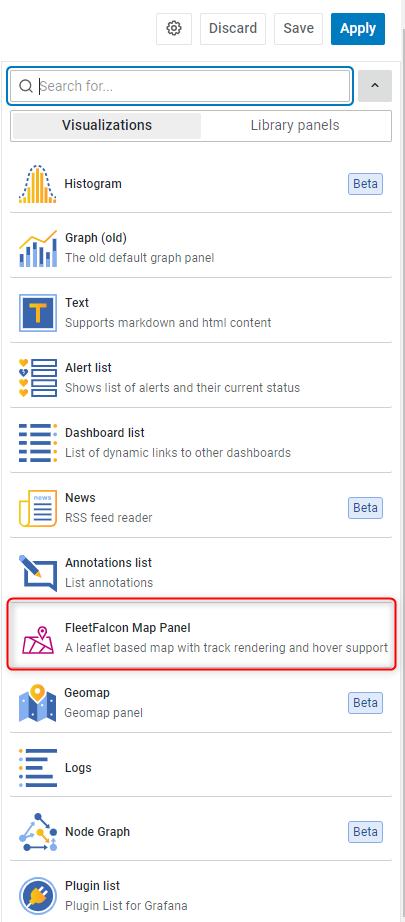
- Change the visualization in the drop-down in the top right corner (“Time Series” is the default).

- Navigate to “FF-Map” and select it.
Make your query:
-
Select your data source.
- Hit “select measurement” and choose your source
- depending on how you collect your data (CAN, XCP, OBDII, UDS, GPS) you will find the according sources there.
- the source “collectd” is there by default and gives the user access to device information of the used connectivity device.
- Hit the “+” next to WHERE and choose “vehicle_name”.
- Select “select_tag_value” and choose a fixed vehicle or “/^$vehicle/” (which will always show the data of the current chosen vehicle in the “Vehicle drop-down” menu).
- Hit “select measurement” and choose your source
-
Select the signals.
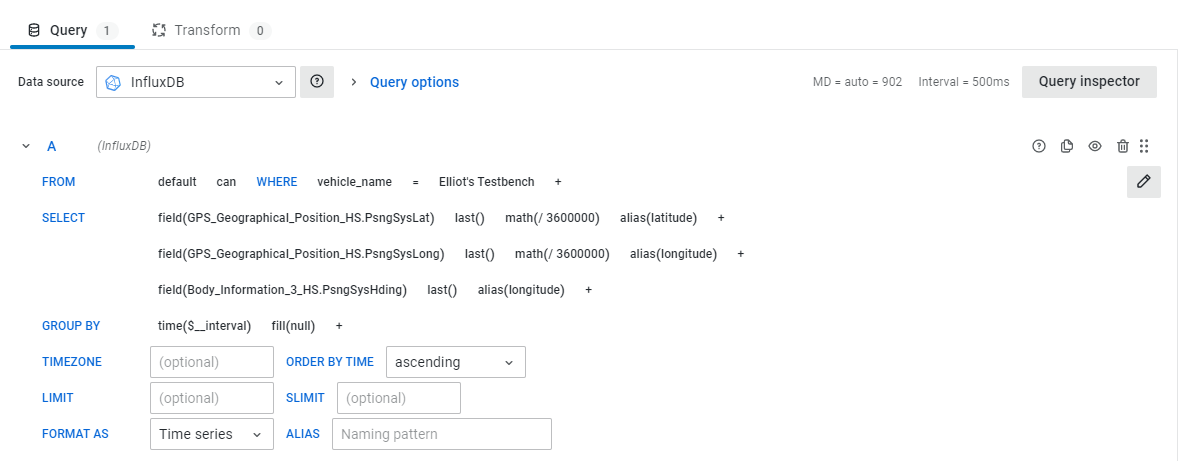
Important that the signals are ordered as follows:
- Latitude in degrees.
- Longitude in degrees.
- (Optional) Heading direction in degrees.
- At this point, the query should look something like this (Remember the heading direction, PsngSysHding in this case, is optional).
-
This example is done using CAN messages from the Vehicle - you can also do this using the “GPS” data in the “From” section
- If you choose to do it this way, since your CAN bus does not have the relevant telemetry data from the vehicle - you do not need to perform the “math/” operator."
- If you choose to do it this way, since your CAN bus does not have the relevant telemetry data from the vehicle - you do not need to perform the “math/” operator."
The map should show the path of the vehicle.
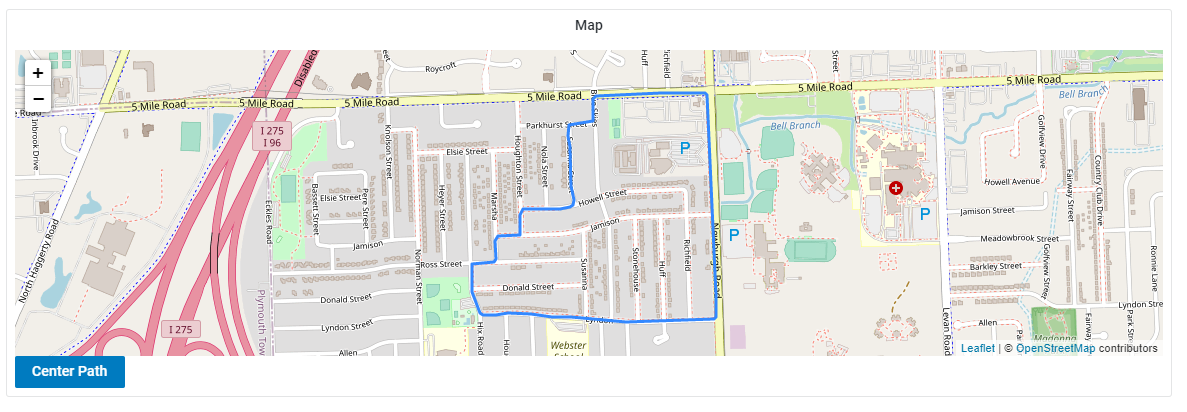
If you are not seeing the path, or if the location appears incorrect.
- The units for each field should be in degrees. Your vehicle’s device may not relay the data in degrees.
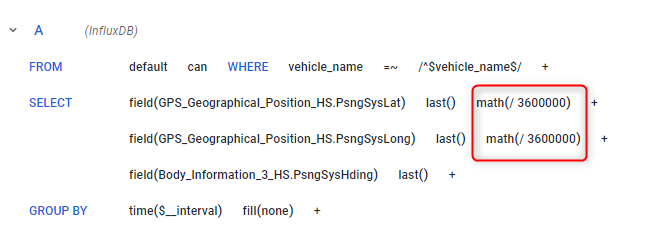
- To fix, use the “math” function as an additional parameter to the signal selector.
- In this case, we received the latitude/longitude coordinates in milli-arcseconds, so we divided by 3.6*10^6 to obtain degrees.
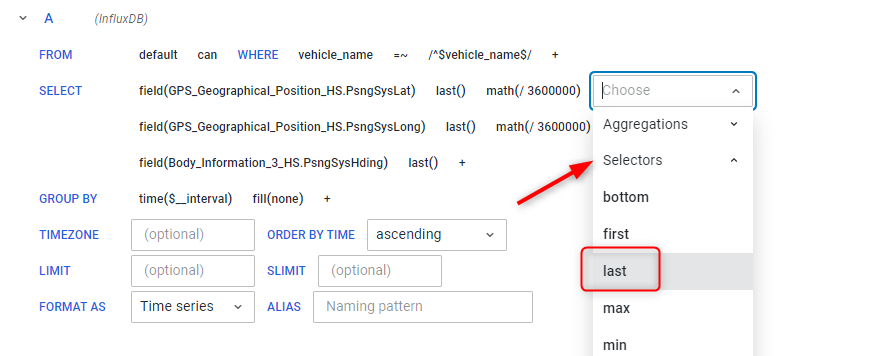
Setting the “Selector” to “last” can remove unncessary noise in the data.
- Hit the “+” icon next to each field row, drop down the “Selectors” tab, and choose “last”.
- Doing this will override the current selector.
Make sure that the time range is encapsulating your data.

At this point your FF-Map panel is ready for use.
- The best way to make full use of this panel is by creating a separate Time Series panel to display a metric of your choice.
- Then, as you hover your cursor over the Time Series graph, a marker will simultaneously move along the path, indicating the GPS location of the vehicle at that time.
- If you have incorporate heading data to the query, the marker will automatically become an arrow. This indicates the direction of the vehicle at the specified time.
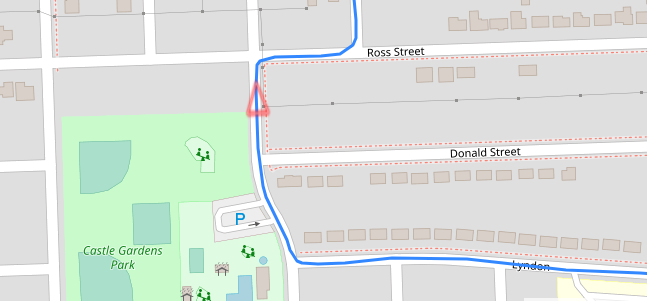
- Scroll to zoom in/out, and drag the map to see different locations.
- Return to a view of your path with the “Center Path” button.
6. Create “Vehicle drop-down” menu
On the “home” page of Grafana.
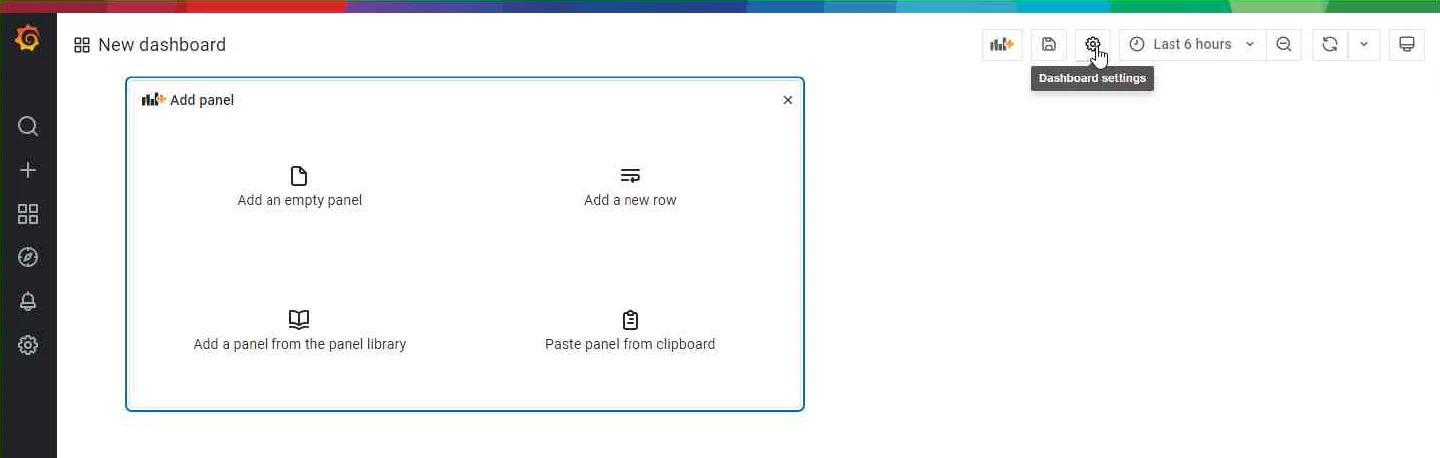
- Click on the Dashboard Settings Cog Wheel in the top right of your page.
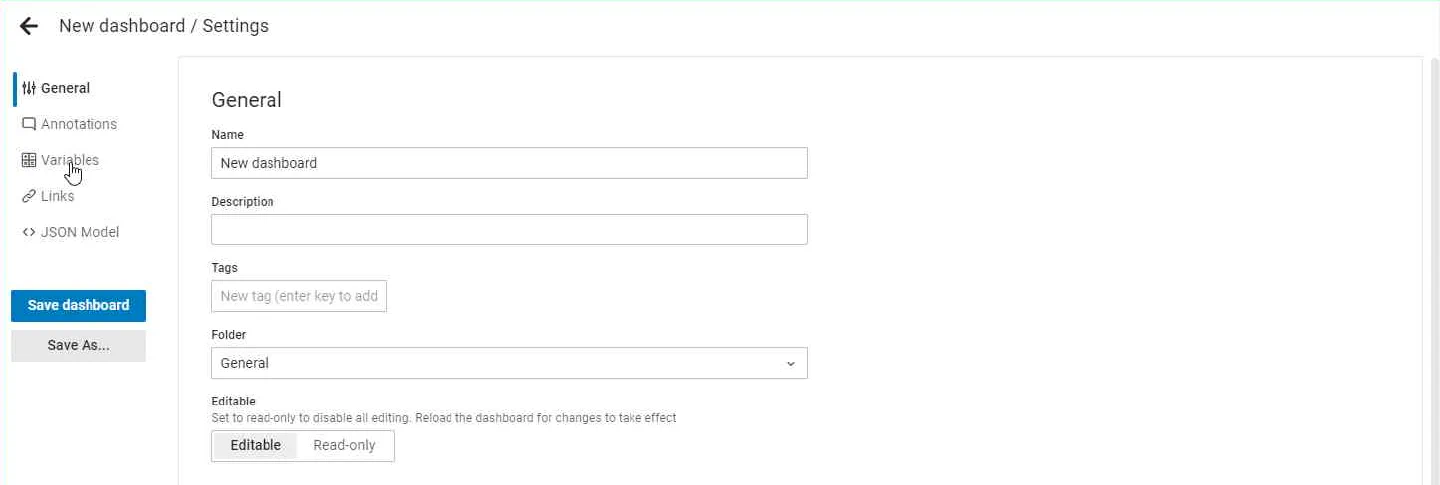
Select “Variables” in the left menu.
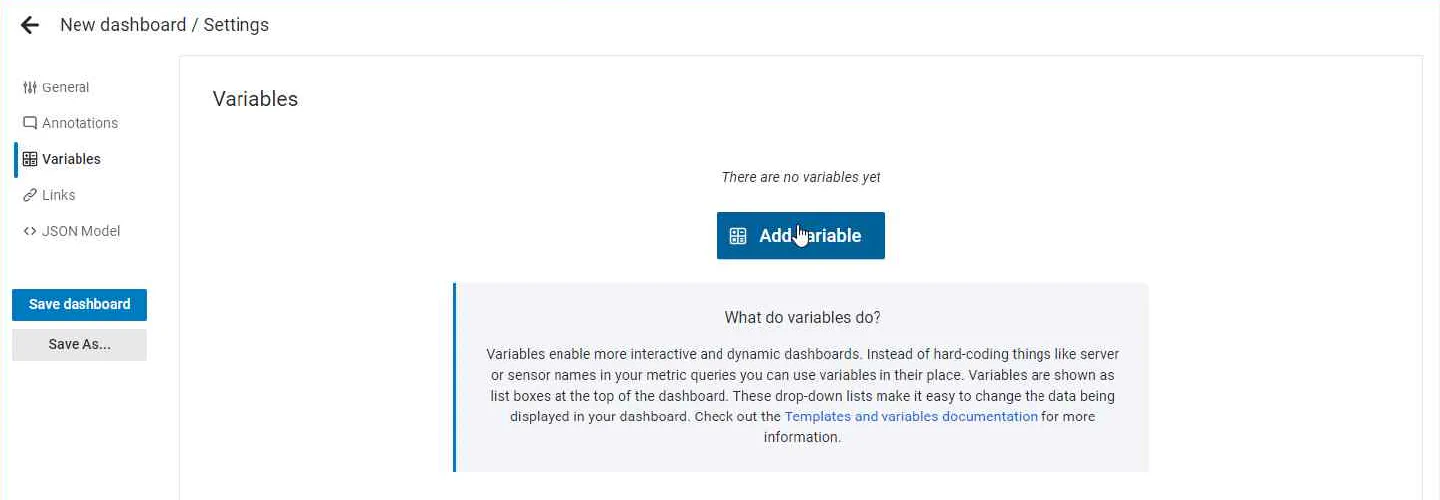
Click on the large “Add Variable” button.
Fill out the following values:
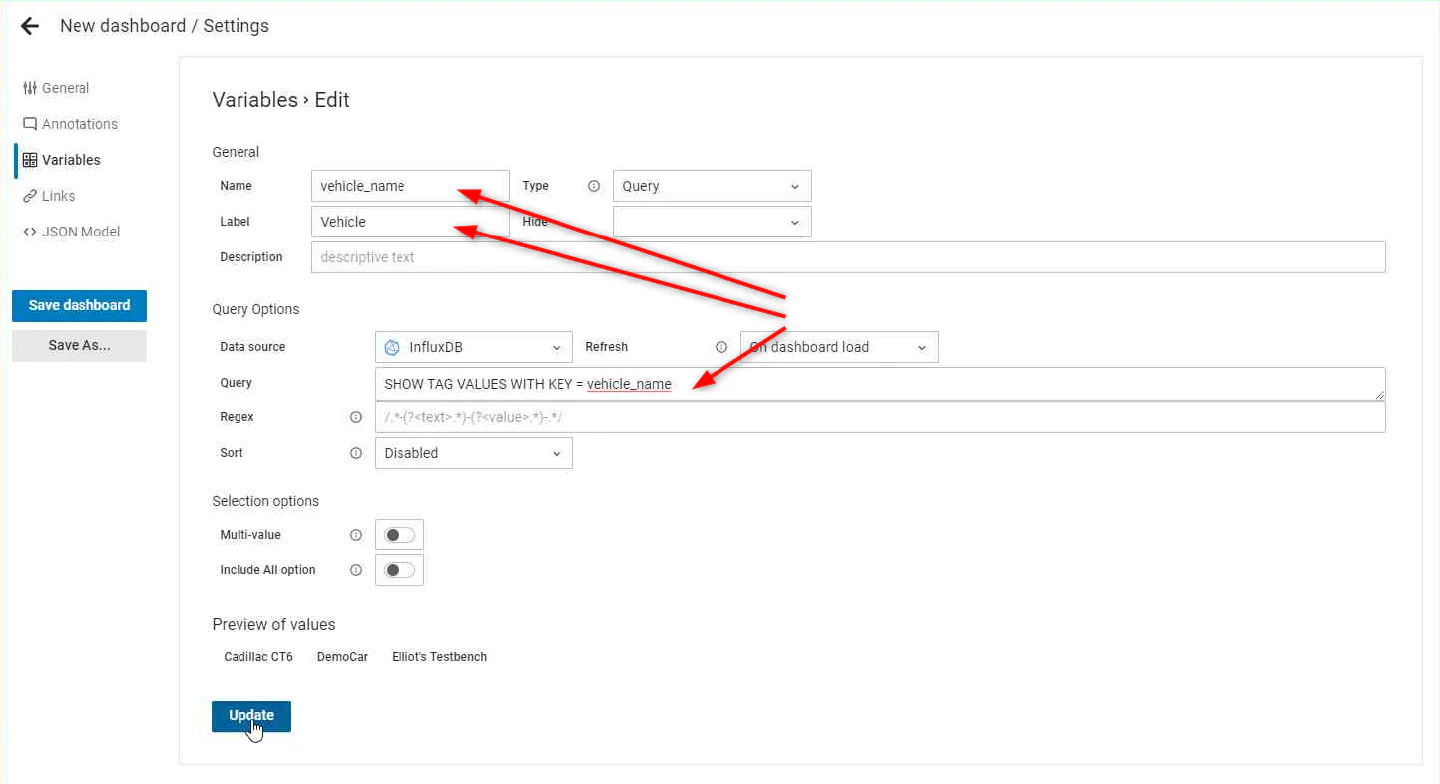
- Name: vehicle_name
- Label: Vehicle
- Query: SHOW TAG VALUES WITH KEY =
Note:
- This can also be done with other “tag” parameter that is available in the WHERE statement in the query builder (see tutorial below).
- It is also possible to have “Multi-value” dropdowns so that you can select multiple or all the vehicles that you are interested at once.