Configurations
A measurement configuration tells a data logger what to record: which signals from which buses and ECUs, at which rates, and whether to write MF4 files on the device. You build configurations on the Configure Measurement page and assign them to devices on the Assignments page.
The first part of this page covers the configuration list and the General tab that every configuration has; the sections after it cover the protocol tabs: CAN, XCP and CCP, UDS and UDS - RMBA and OBD, GPS and MDF recording.
The Configuration List
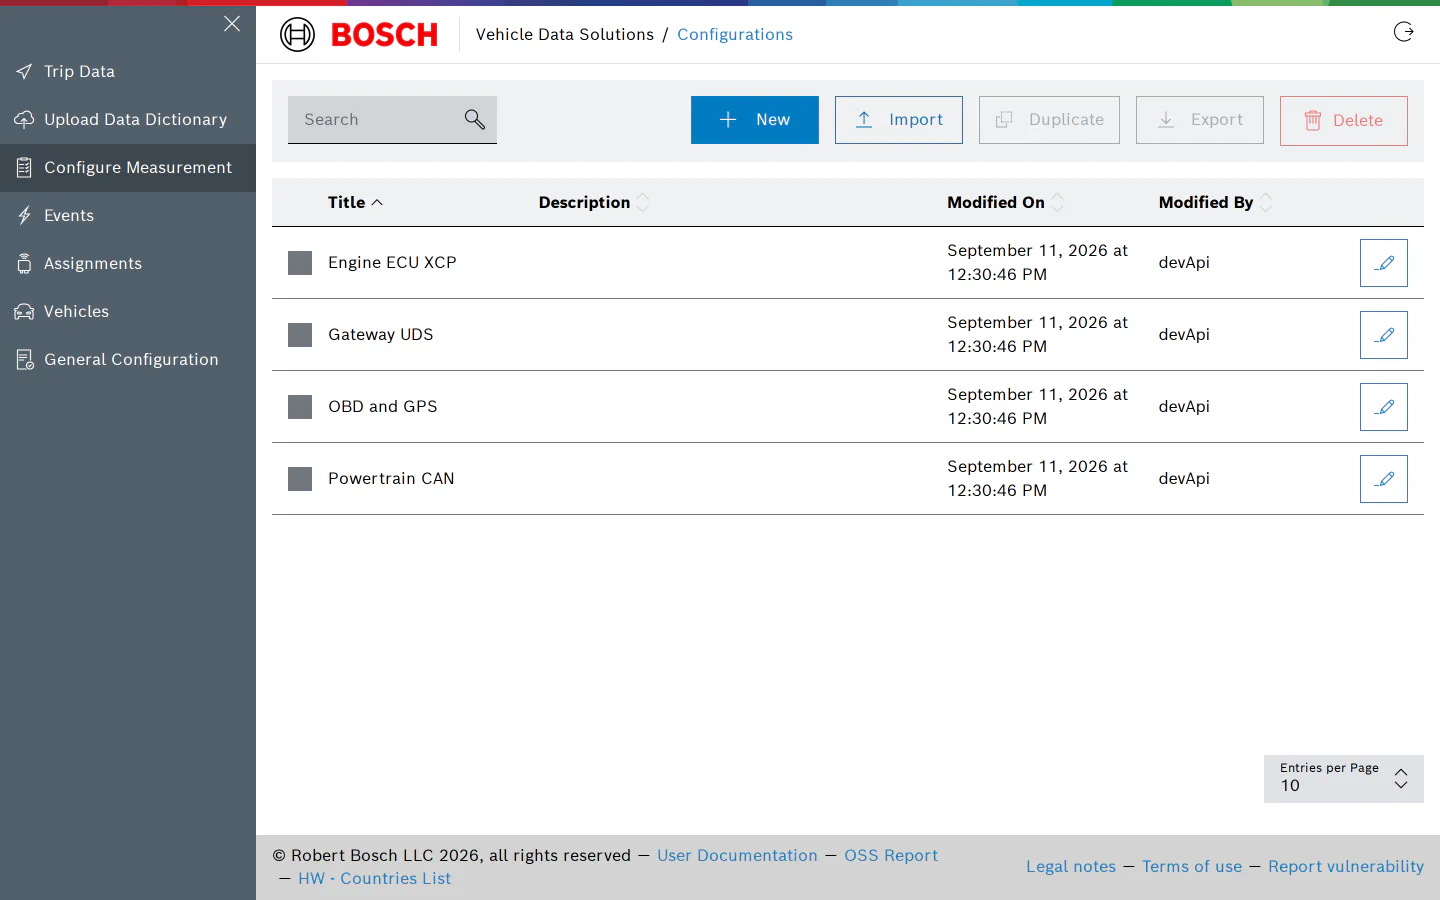
The list shows every configuration of the project with its description and who last modified it. The buttons above the list:
- New opens the form for a new configuration.
- Import loads a configuration from a JSON file exported earlier. A success message confirms the import; a malformed file or a server error shows the reason.
- Duplicate copies the selected configuration under a new name.
- Export downloads the selected configuration as JSON. The file wraps the settings under a
speckey, which is the form Import expects. - Delete disables the selected configurations. They disappear from the list and can no longer be assigned; devices that still carry them keep recording until they receive another configuration.
The pencil button at the end of a row opens the configuration for editing.
Create a Configuration
Click New. Enter a Title and, optionally, a Description, add the channels you need with the Raw CAN, XCP, UDS and UDS - RMBA buttons, pick a dictionary for each, and click Create.
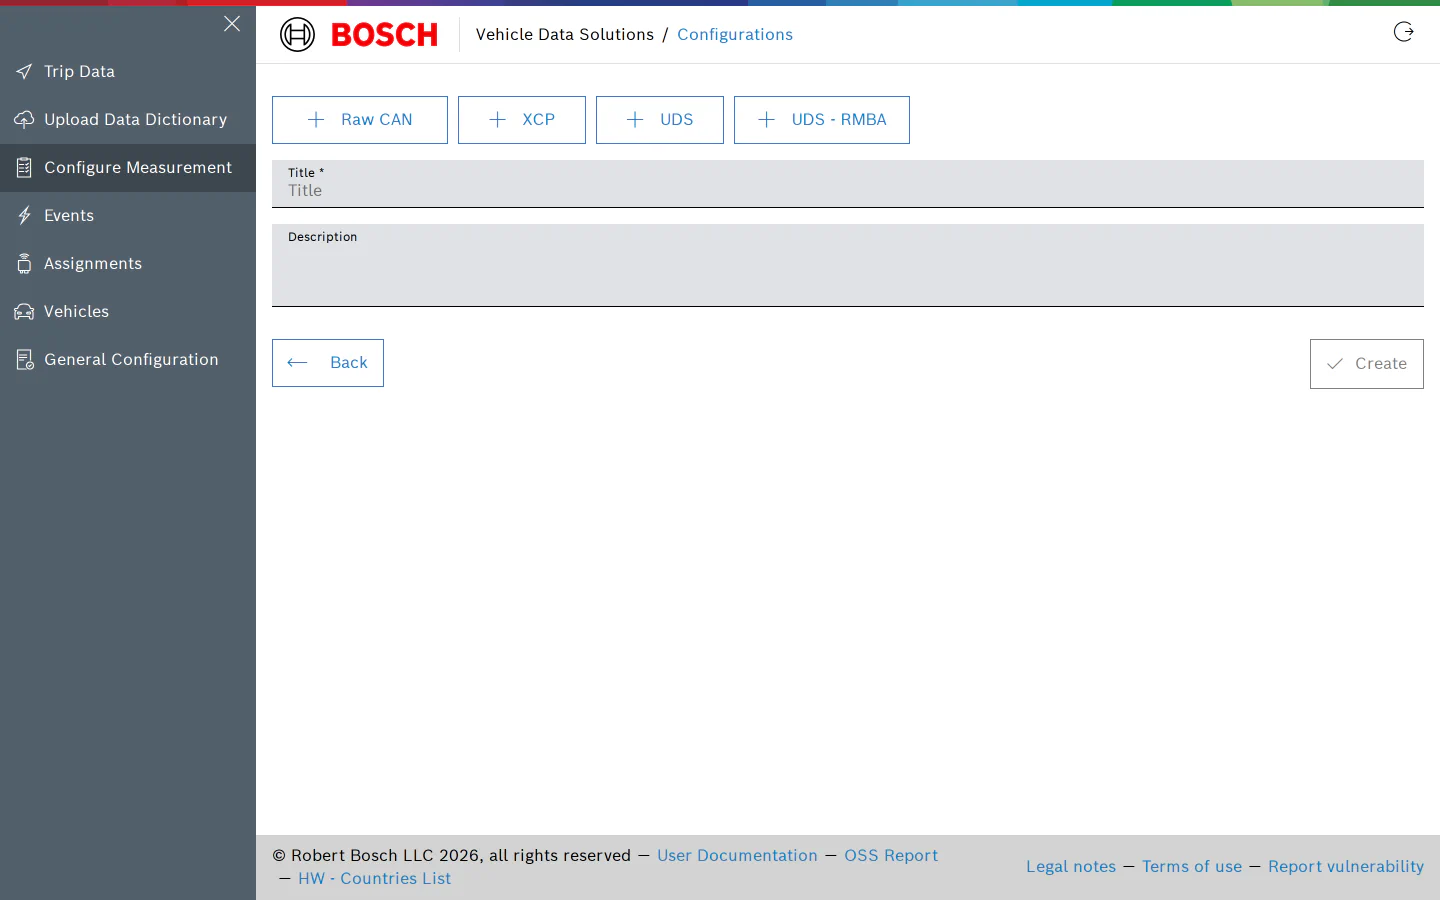
The title is how the configuration appears on the Assignments and Trip Data pages and in exported file names. It must be 5 to 50 characters of letters, digits, spaces, underscores and dashes, with at least five letters or digits.
The General Tab
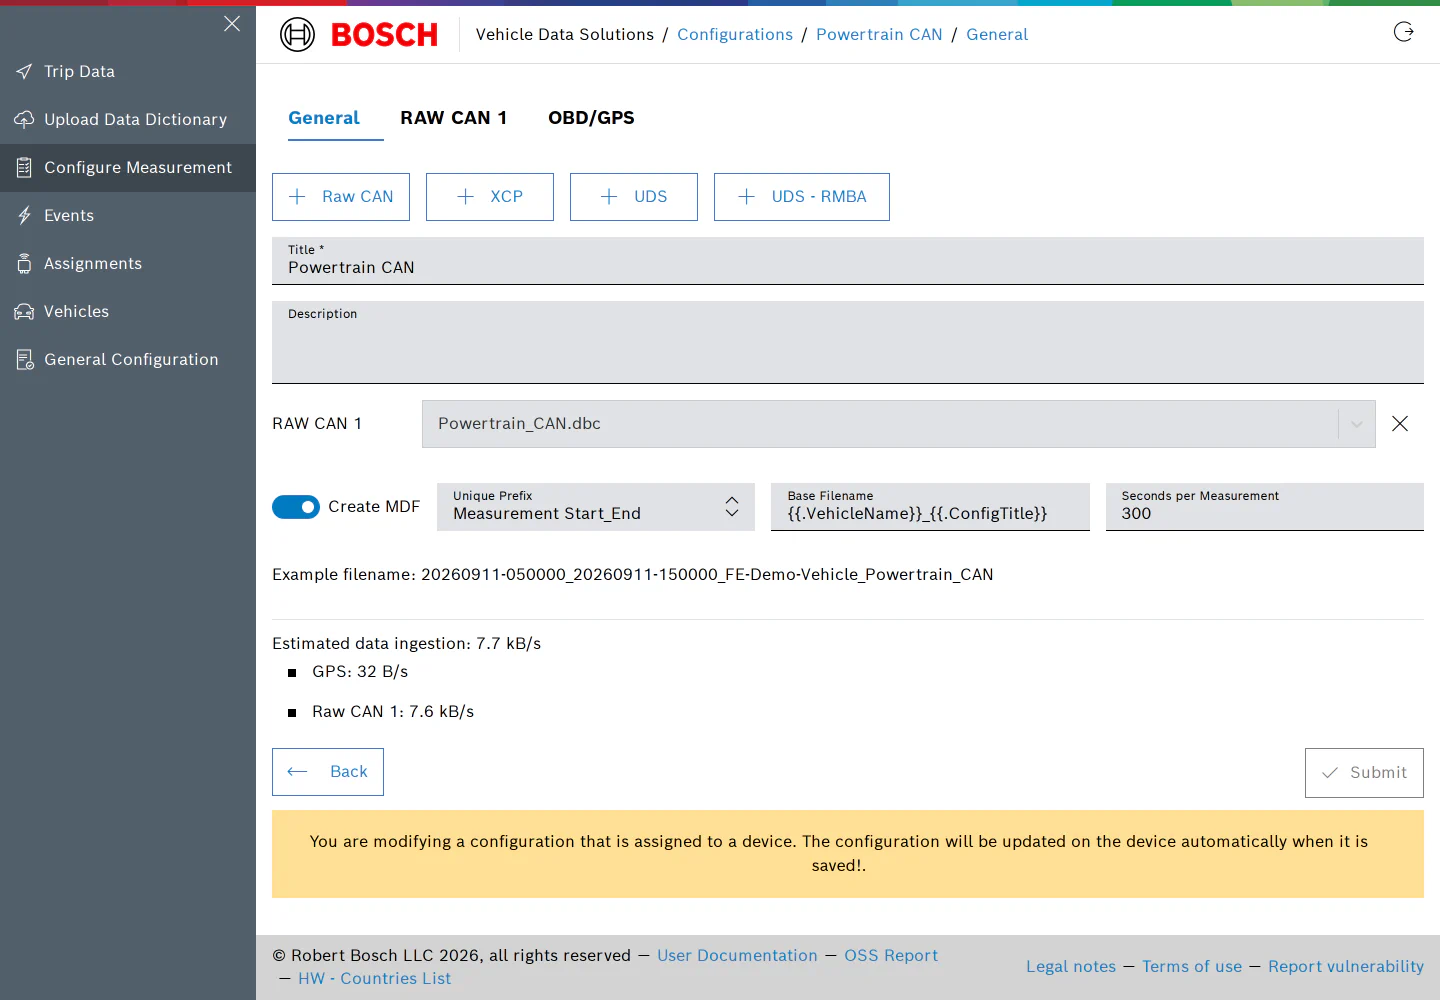
The General tab of an existing configuration holds:
- The channel buttons. Each click adds a channel of that protocol; a configuration can hold up to twenty channels per protocol. Every channel becomes a tab, named RAW CAN 1, XCP 1, UDS 1 or RMBA 1 and so on, once a dictionary has been chosen for it. The cross removes a channel.
- The dictionary of each channel: a DBC or ARXML for CAN, an A2L for XCP and RMBA, an XLSX or XLSM for UDS, from the files on the Upload Data Dictionary page.
- Create MDF and the file naming settings, described on the OBD, GPS and MDF recording page.
- Estimated data ingestion: the rate at which the configuration will send telemetry, broken down per channel. Channels whose rate cannot be predicted are listed as “Not estimated”. Compare it with the Data Ingest view of the project.
Every channel, and OBD and GPS when enabled, must have a bus selected on its own tab; the configuration cannot be saved otherwise, and the error names the channel.
Rates
Every CAN message, XCP measurement and UDS identifier has a Telemetry Rate. The presets are 10ms, 100ms, 1s, 10s, 30s, 1m, 5m, 10m and none. You can also type a rate: any Go duration between 1ms and 1h is accepted, for example 45s, 2m or 1m30s. When you type to filter the list, the closest preset is highlighted first, so 10m selects 10m rather than 10ms.
What the rate controls differs by protocol, and this is worth understanding before you tune it:
- The telemetry rate decides how often a value is sent to the cloud and stored in the time-series database behind Grafana and AutoPlot. It does not change what the logger records: the raw trip files and the on-device MF4 files hold every sample the logger saw.
- For CAN, the logger receives whatever the bus transmits, so the raw data has the bus’s own rate; the telemetry rate only thins it for the cloud.
- For XCP and CCP, the ECU sends a measurement on the raster you choose; that is the rate in the raw data, and the telemetry rate thins it for the cloud.
- For UDS and UDS - RMBA, there is no bus traffic until the logger asks. The rate is the request rate: it sets how often the logger polls the ECU, so raw data and telemetry arrive at the same rate.
- For OBD, the interval on the OBD/GPS tab is the polling rate in the same way.
- For GPS, the interval gates the collection itself: positions arriving faster than it are discarded on the device and never recorded.
none keeps an item in the configuration and in the raw recordings but sends nothing about it to the cloud. Use it for signals you want in the MF4 files without paying for them as telemetry.
The Bulk Operations button on each protocol tab changes the rate of several items at once: select them, pick a Rate and click Apply Rate.
Save and Update
Submit saves the configuration. The button is enabled only when the form has changes and is valid. Every save creates a new version of the configuration; the list always shows the latest.
If the configuration is assigned to a device, a banner reminds you that saving pushes the new version to that device automatically. There is nothing to do on the Assignments page after an edit.
If you leave the editor with unsaved changes, the application asks for confirmation first.
CAN
A RAW CAN channel records signals from one vehicle bus, decoded with a DBC or ARXML file. Add the channel on the General tab of the configuration, choose the dictionary, and open its tab.
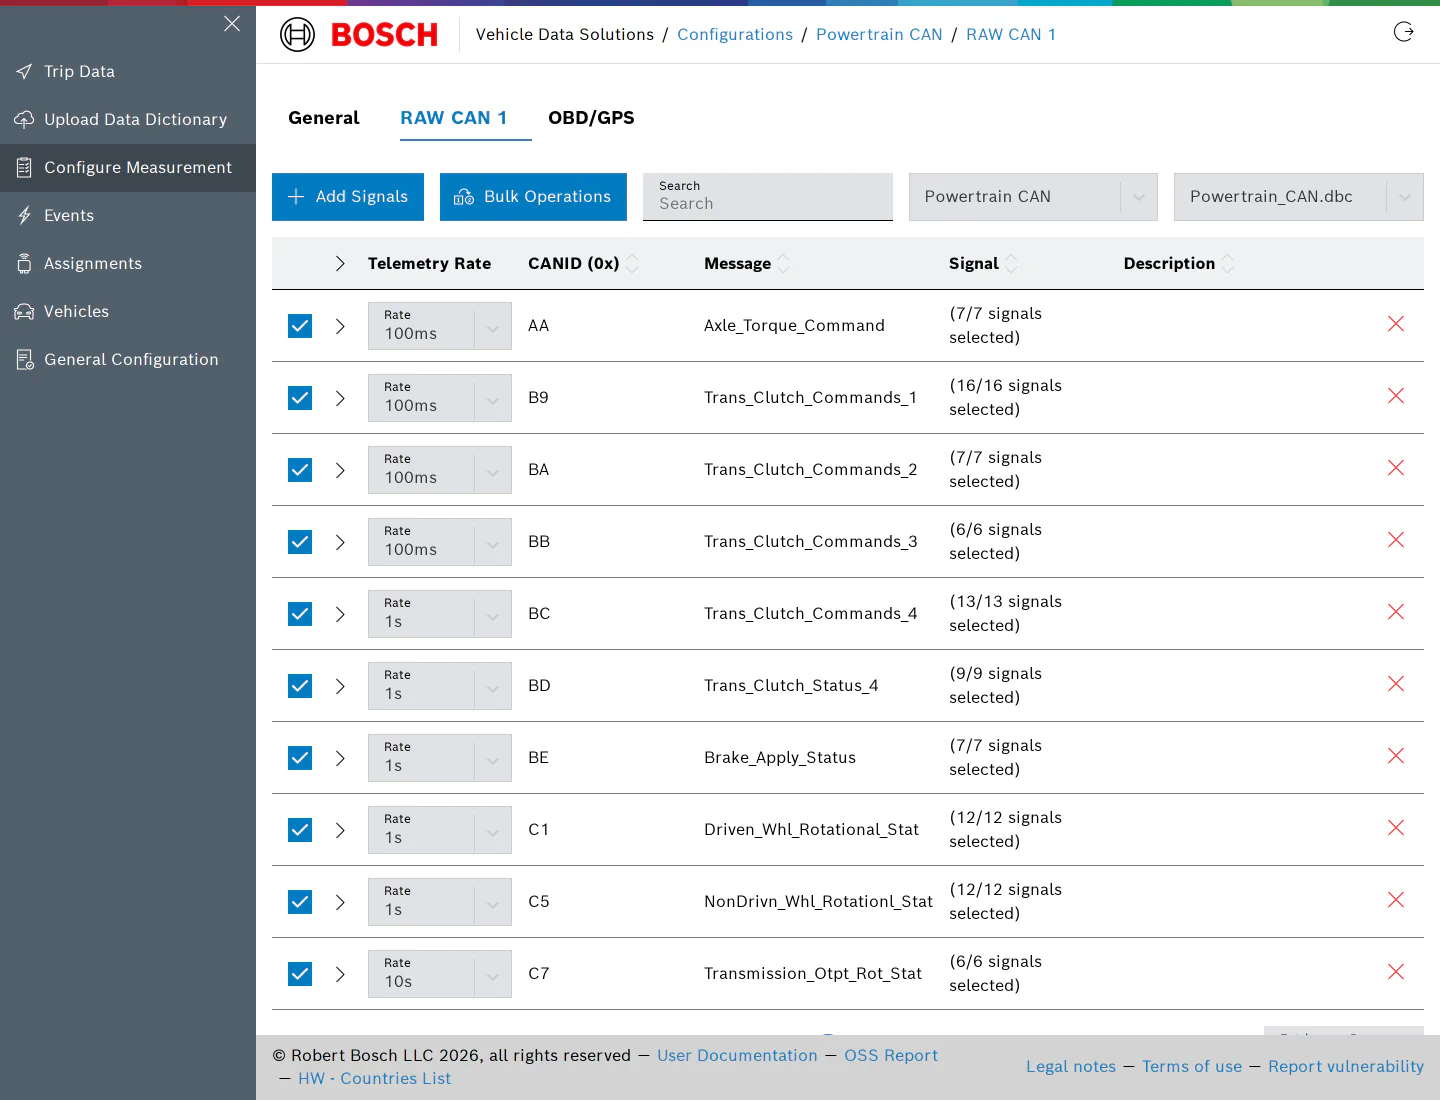
The two dropdowns at the top select the bus the channel listens on (created on the General Configuration page) and the dictionary. Both are required.
Add CAN Signals
Click Add Signals to open the dictionary. Search by CAN ID, message name, signal name or description; tick a whole message, or expand it with the arrow and tick individual signals. The Rate dropdown in the dialog sets the telemetry rate for the messages you add. Close the dialog when you are done.
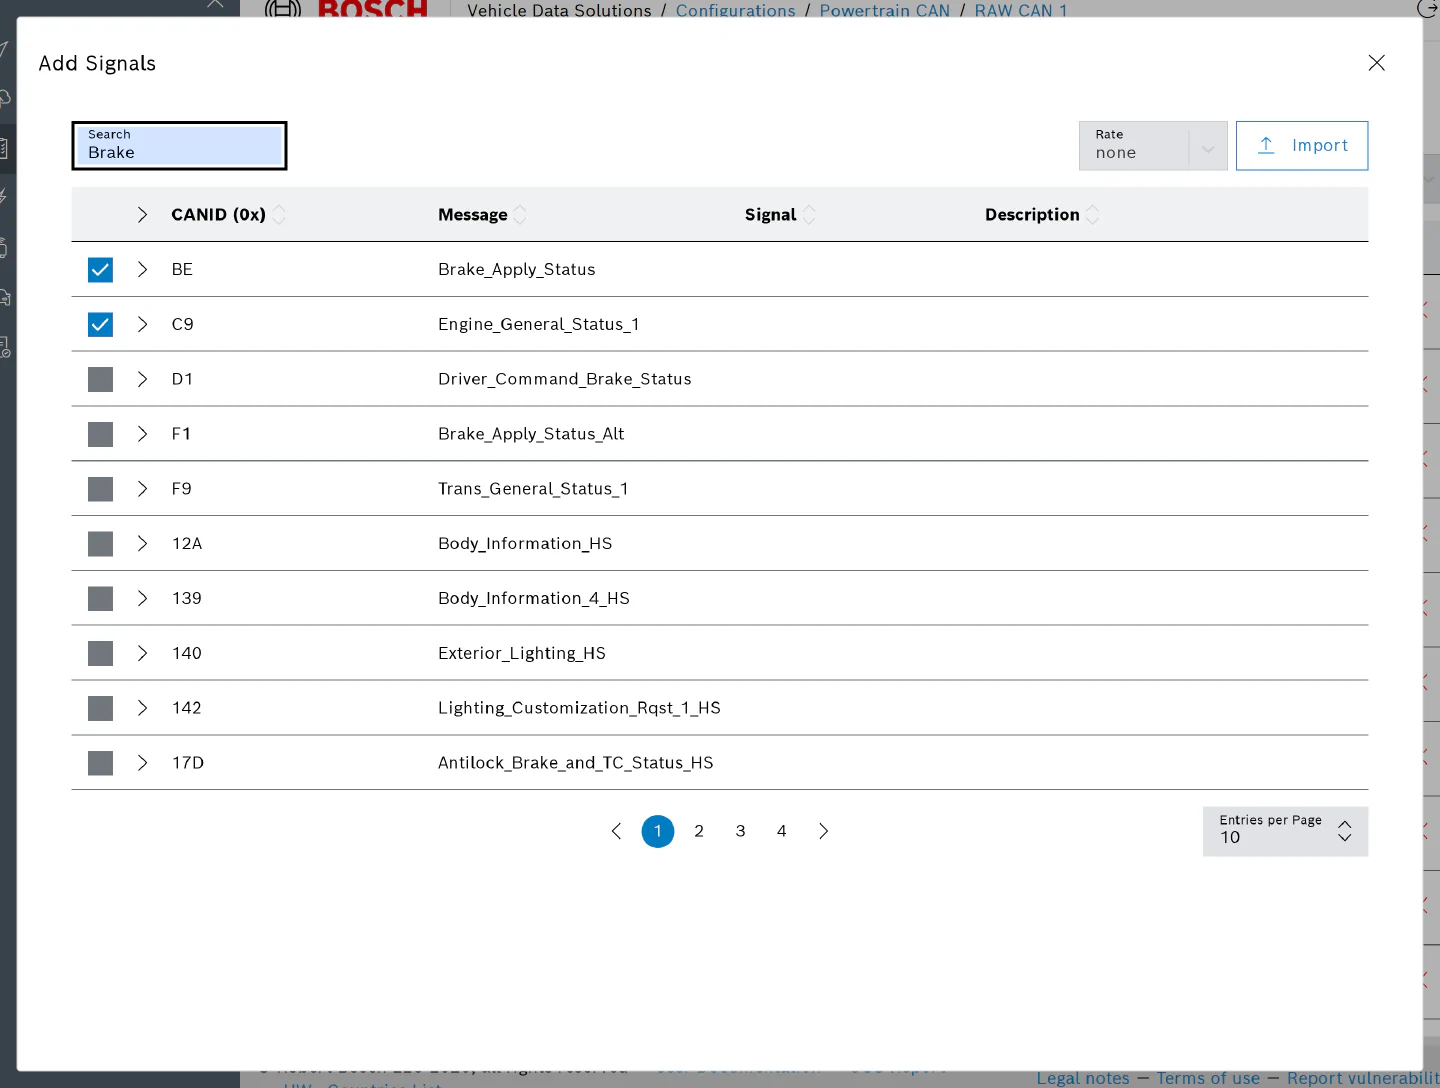
Import in the dialog reads a plain text file with one signal name per line (lines starting with # or ; are ignored) and selects those signals, with the rate chosen in the dialog. Names that do not exist in the dictionary, or match more than one message, are listed in a warning so you can add them by hand.
Selected Messages and Rates
Back on the tab, each selected message is a row with its Telemetry Rate, CANID, name and the count of selected signals. Expand a row to see and change the individual signals; the cross removes the message.
The rate applies per message because a CAN frame carries all its signals at once. It thins what is sent to the cloud; the raw recording keeps every frame the bus transmitted. The presets and the custom values are described under Rates.
Bulk Operations
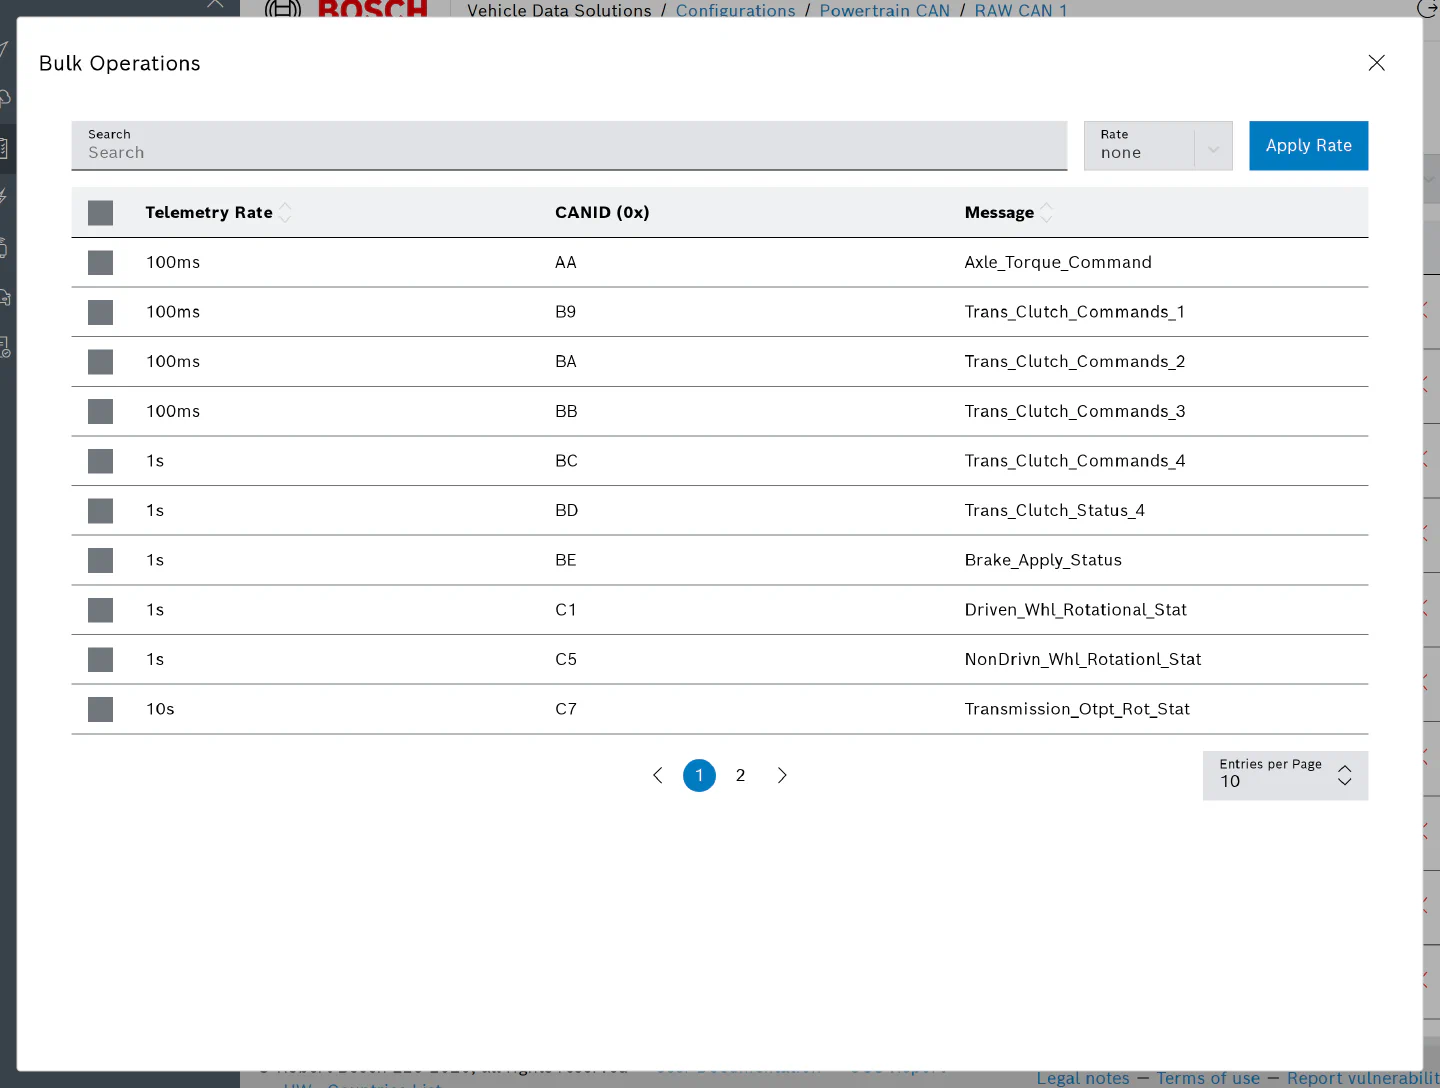
Bulk Operations sets one rate for many messages at once: select them in the dialog, choose the Rate and click Apply Rate.
CAN Notes
- A DBC and an ARXML are handled the same way; the dictionary dropdown offers both.
- Signals from several buses go into separate channels, one per bus, each with its own dictionary and bus selection.
- The telemetry rate controls only what is sent to the cloud. Raw trip files, and on-device MF4 recording when enabled, hold the selected messages at the rate they arrive on the bus; see OBD, GPS and MDF recording.
- The source of the dictionary decides the measurement the signals are stored under in Grafana; see Upload Data Dictionary.
XCP and CCP
An XCP channel reads measurements straight from an ECU’s memory, described by an A2L file. The same channel type serves CCP: the protocol and the transport come from the A2L, not from a setting in the editor.
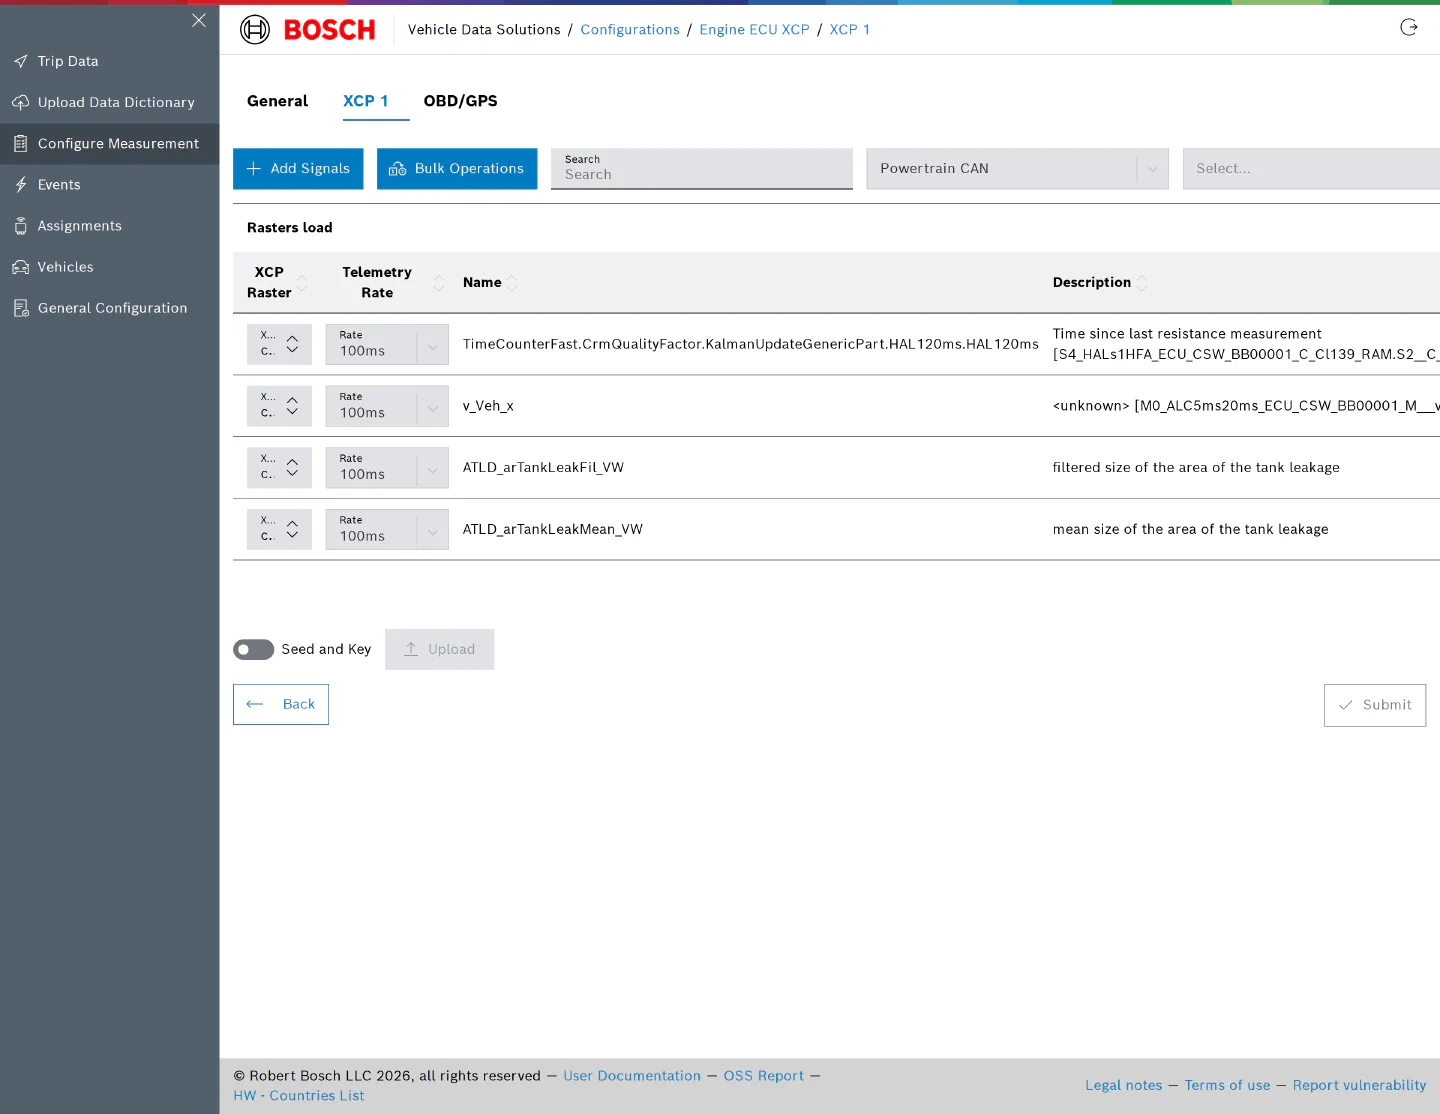
At the top of the tab you choose the bus, the A2L, and the instance. The instance is one of the XCP or CCP connections the A2L defines (the dropdown offers “No Instance” and the names from the file). Each instance carries its transport: XCP on CAN, XCP on Ethernet, or CCP on CAN. An ECU that is reached through an xETK, for example, appears as an instance with an Ethernet transport; select that instance and the channel talks to the xETK.
Add XCP Measurements
Add Signals opens the A2L’s measurements. Search by name or description, tick the measurements you want, and close the dialog. Each selected measurement gets two settings on the tab:
- XCP Raster: the ECU task (DAQ event) that samples it, which is the rate the measurement is recorded at. The dropdown lists the rasters the A2L defines for the selected instance.
- Telemetry Rate: how often its value is sent to the cloud, thinned from the raster; see Rates.
Bulk Operations applies one rate, and separately one raster, to several measurements at once.
Rasters Load
Every raster has a byte budget per cycle. Rasters load expands to show each raster and how full it is; hover a raster for the exact figures, and hover a measurement to see how many bytes it takes. A raster whose capacity is exceeded turns red and the editor shows a warning. Saving is still possible, but an overloaded raster can cause measurement errors on the ECU, so move measurements to a slower raster until the load is below 100 percent.
Seed and Key
If the ECU protects its XCP connection, switch on Seed and Key and upload the algorithm library (.so) supplied by the ECU vendor. The tab confirms the upload or reports an error; with the toggle on and no file uploaded the configuration cannot be saved.
INCA Lab Files
Signal lists saved from INCA can be imported and exported:
- Import (Replace) replaces the selection with the measurements listed in the
.labfile. - Import (Append) adds them to the current selection, skipping names that are already selected.
- Export to .lab writes the current selection.
Entries in the file that the A2L does not contain, or whose raster does not exist, are listed in a warning after the import; the rest are applied.
Changing the A2L
When you switch a channel to another A2L, the editor compares the selection with the new file and lists the measurements that would be lost in a Signals not found in new A2L dialog before it applies the change.
UDS and UDS - RMBA
A UDS channel polls an ECU with diagnostic requests. The identifiers it can read come from an XLSX or XLSM definition file; the channel also collects diagnostic trouble codes (DTCs) if you switch that on. A UDS - RMBA channel reads ECU memory by address instead and is described at the end of this page.
Addressing the ECU
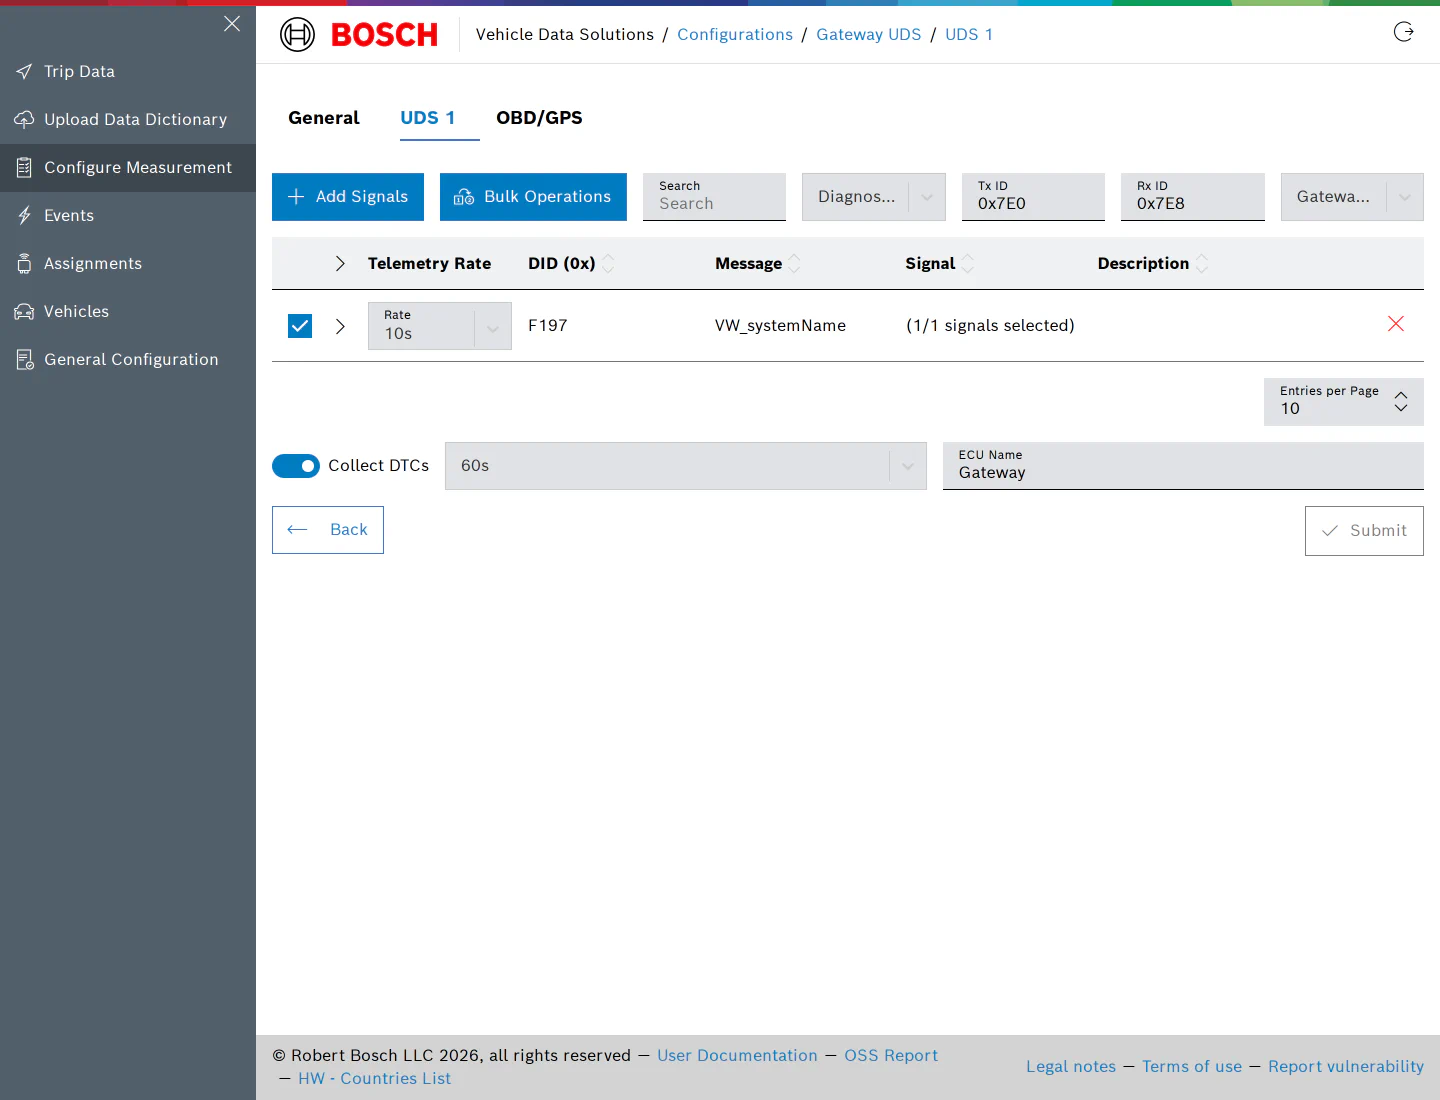
Each UDS channel talks to one ECU, so create one channel per ECU. At the top of the tab:
- Bus: the diagnostic bus the ECU is on.
- Tx ID and Rx ID: the request and response CAN identifiers of the ECU, entered as hexadecimal (
0x7E0,0x7E8). Many DBC and MDX files list them as request and response identifiers. The two must differ, and the same pair cannot be used by another UDS channel on the same bus in this configuration. - The definition file with the identifiers (DIDs) the ECU supports.
Add UDS Identifiers
Add Signals opens the definition file. Search by DID, name or description, tick the identifiers you want and close the dialog. Each row on the tab shows the DID, its signals and a Telemetry Rate. For UDS the rate is the polling rate: the logger requests the identifier at that interval, so it is also the rate in the raw data. Rates are described under Rates; Bulk Operations sets one rate for several identifiers.
Keep polling rates modest. A diagnostic request occupies the ECU and the bus, so start at 1s or slower and only go faster for identifiers that need it.
Collect DTCs
Switch on Collect DTCs to have the logger read the ECU’s active trouble codes (service 0x19) periodically. Two fields are then required:
- The rate: presets of 1s, 10s, 30s, 60s, 5m and 10m, or a typed value between 1s and 1h. Once a minute is enough for most purposes.
- ECU Name: the name the DTCs are stored under, so codes from different ECUs can be told apart. It must be unique within the configuration.
UDS - RMBA
A UDS - RMBA channel uses the UDS “read memory by address” service to read variables directly from ECU memory. It takes an A2L rather than an XLSX, because the A2L holds the addresses and sizes of the variables. Add it with the UDS - RMBA button on the General tab, choose the bus and the A2L, and select variables with Add Signals exactly as on the XCP tab. As with UDS, the rate per variable is the request rate, so raw data and telemetry arrive at the same rate. Switching the A2L shows the same Signals not found in new A2L dialog.
OBD, GPS and MDF Recording
Every configuration has an OBD/GPS tab. OBD and GPS need no dictionary: you switch them on, choose a bus and a rate, and the logger takes care of the rest.
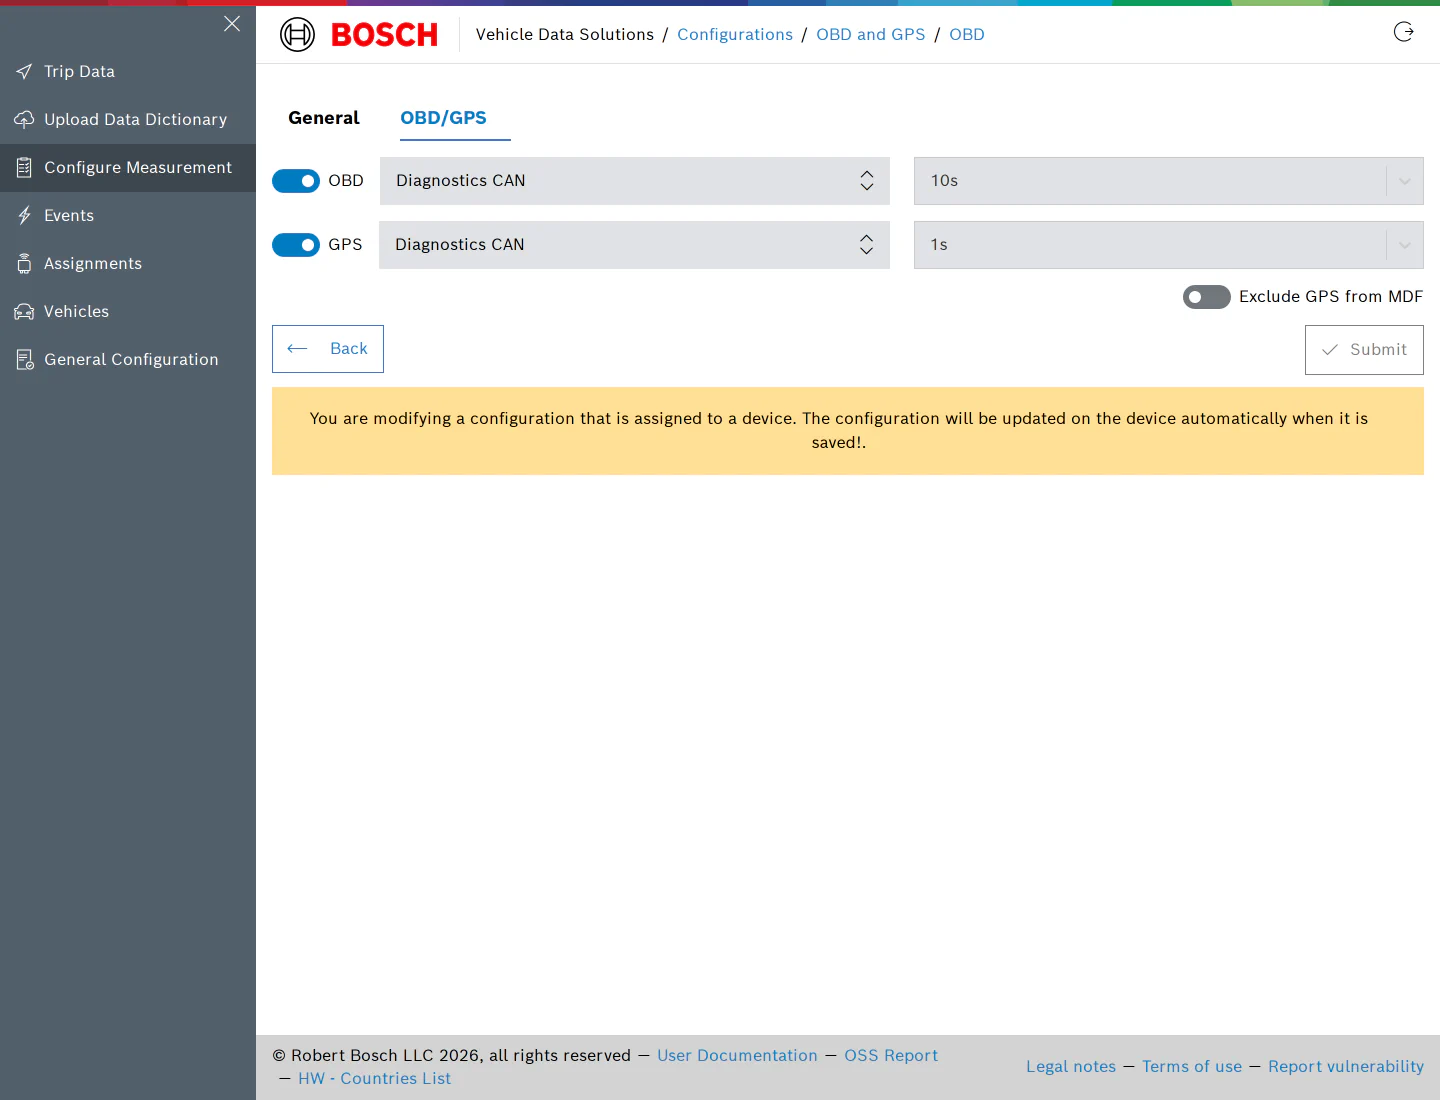
OBD
Switch on OBD, select the bus the vehicle’s diagnostic connector is wired to, and choose the polling interval. The presets are 1s, 10s, 30s, 1m, 5m and 10m; a typed value between 1s and 1h is also accepted. Sub-second polling is not allowed, and neither is none: a full OBD snapshot takes longer than a second to collect.
You do not select individual parameters. At the start of a trip the logger probes the vehicle and picks the matching OBD dialect (classic J1979 or the newer J1979-2), then collects every parameter the vehicle supports, plus trouble codes, freeze frames, monitor readiness and in-use performance ratios. The interval is the maximum request rate: the logger caps OBD traffic at 80 percent of the bus time and slows the polling down if the vehicle answers slowly, and reports this in the trip log.
OBD data is written under the j1979 or j1979-2 measurement and can be viewed as an OBD snapshot per trip.
GPS
Switch on GPS and choose the interval, 1s by default. The rate gates the collection itself: fixes arriving faster than the interval are discarded on the device. GPS also needs a bus selected, which is the bus the position is published on for the logger’s internal routing; use the same bus as OBD if you have no other preference.
Exclude GPS from MDF keeps position data out of the MF4 files recorded on the device while GPS continues to be sent as telemetry and shown on dashboards. The raw trip data still contains it; to strip GPS from a converted download as well, use the Remove GPS location option when exporting trip files.
MDF Recording
Besides streaming telemetry, the logger can write MF4 measurement files on the device, which are uploaded with the trip and appear in its trip files. The settings are on the General tab:
- Create MDF switches recording on.
- Unique Prefix is prepended to every file name so no two files collide: Measurement Start_End (the default), Measurement Start, or Trip Start_Measurement Index. Timestamps are UTC in the form
YYYYMMDD-HHMMSS, so a default prefix looks like20260907-050000_20260907-150000. - Base Filename follows the prefix. It may contain these variables:
- {{.VehicleName}}
- {{.ConfigTitle}}
- {{.MeasurementStart}}
- {{.MeasurementEnd}}
- {{.MeasurementIndex}}
- {{.TripStart}}
- Seconds per Measurement is the length of each file, at least 30 seconds and 300 by default.
The tab shows an Example filename built from the current settings. Recorded files carry the trip, device, vehicle, configuration and the vehicle attributes such as VIN in their metadata.
Permissions
Viewing configurations needs the permission to list them; users without it see an “Access Denied” message. Creating, editing, importing, duplicating and deleting need the corresponding write permissions, which the User and Admin roles have. Without the update permission the editor opens read-only.