A trip is one recording session of a device: it starts when the logger begins collecting with its configuration and ends when the logger stops or goes to sleep. The Trip Data page lists the trips of your project and is the starting point for looking at their data.
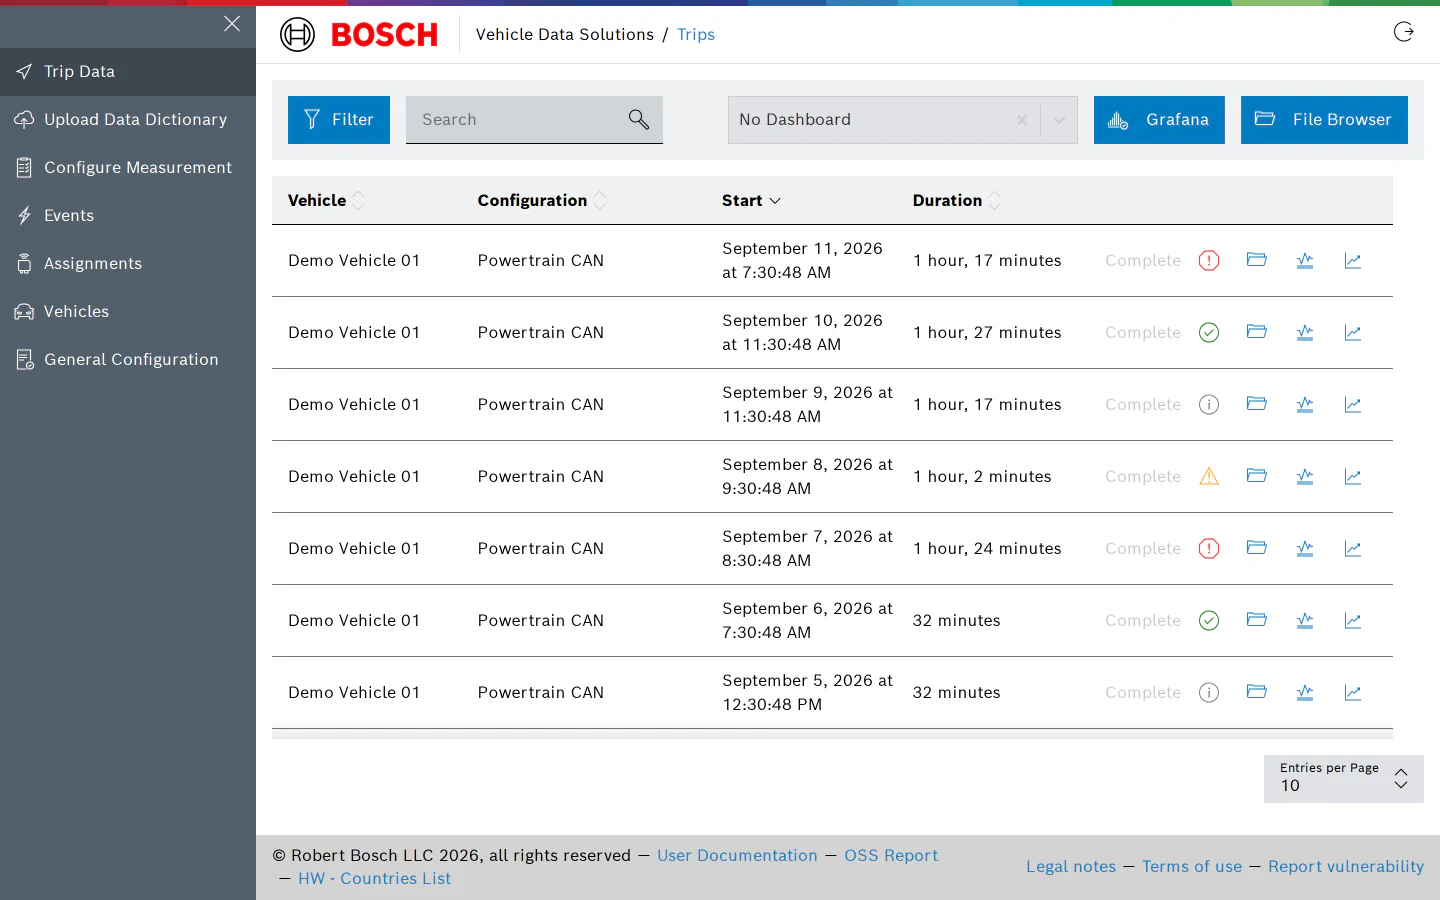
Each row shows the Vehicle, the Configuration the trip was recorded with, its Start time and Duration, then the trip state and the health icon:
- Active means the logger is still recording this trip; Complete means it has ended.
- The icon summarises the trip log: green for OK, orange for a warning, red for an error, grey when the logger has not reported anything yet.
Trips
Find Trips
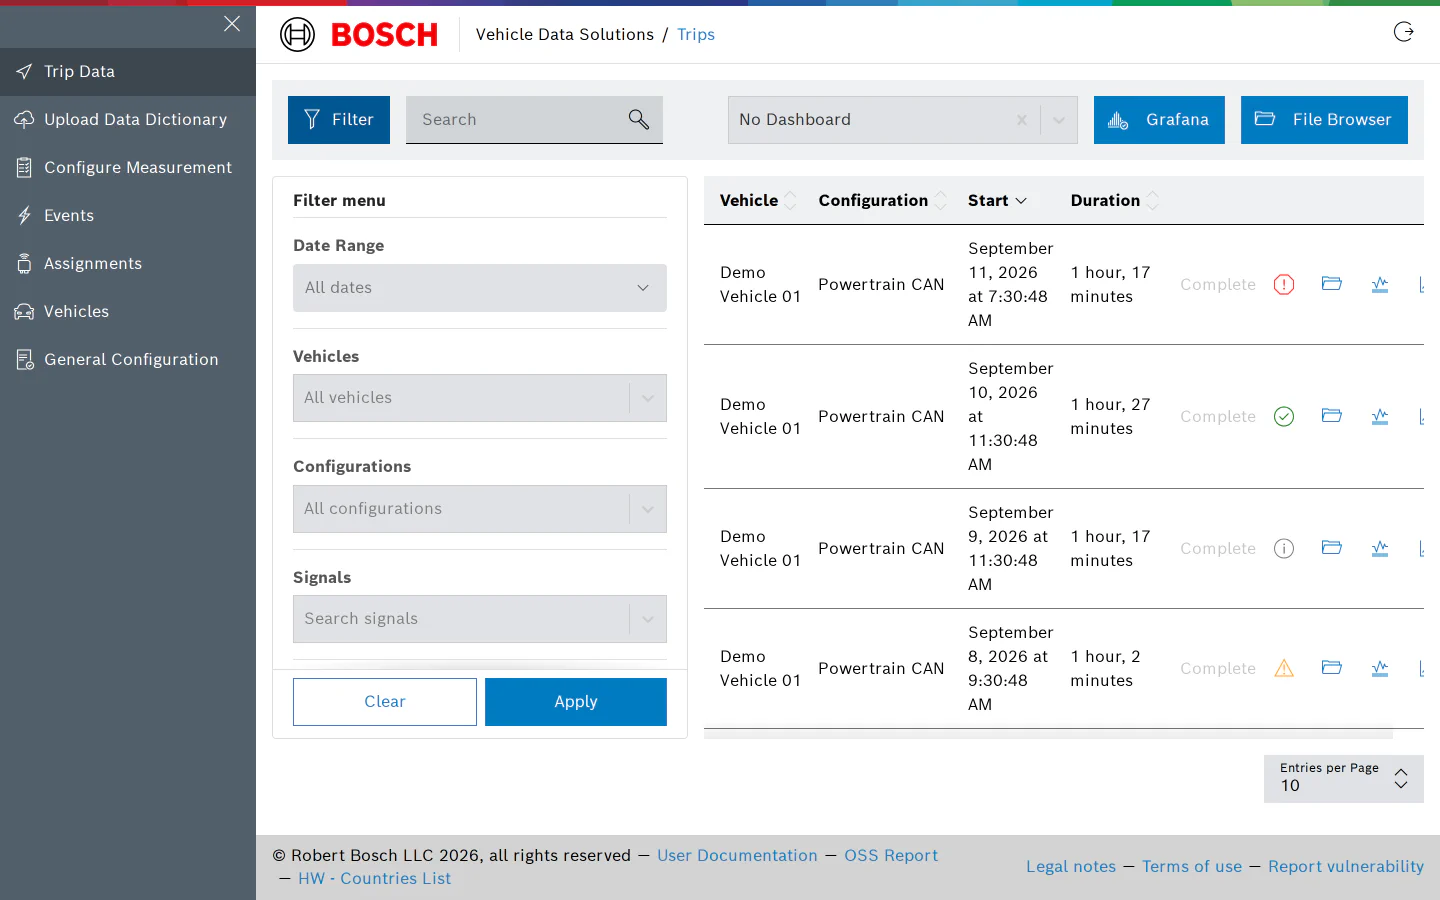
Type in the search box to filter the list, or click Filter to open the filter panel: a date range, Vehicles, Configurations, Signals (trips that recorded a given signal) and Status. Active filters are counted on the Filter button; Clear all filters resets them.
Row Actions
The buttons at the end of a row:
- Trip logs (the health icon): the messages the logger reported during the trip. The button is disabled with “Trip log unavailable” while no log exists.
- Show trip files (folder): the recorded files of the trip and their export; see Trip Files.
- Plot signals: opens the trip in AutoPlot.
- Go to dashboards: opens the dashboard chosen in the dropdown above the list in Grafana, with the vehicle, device and the trip’s time range preselected.
Trip Logs
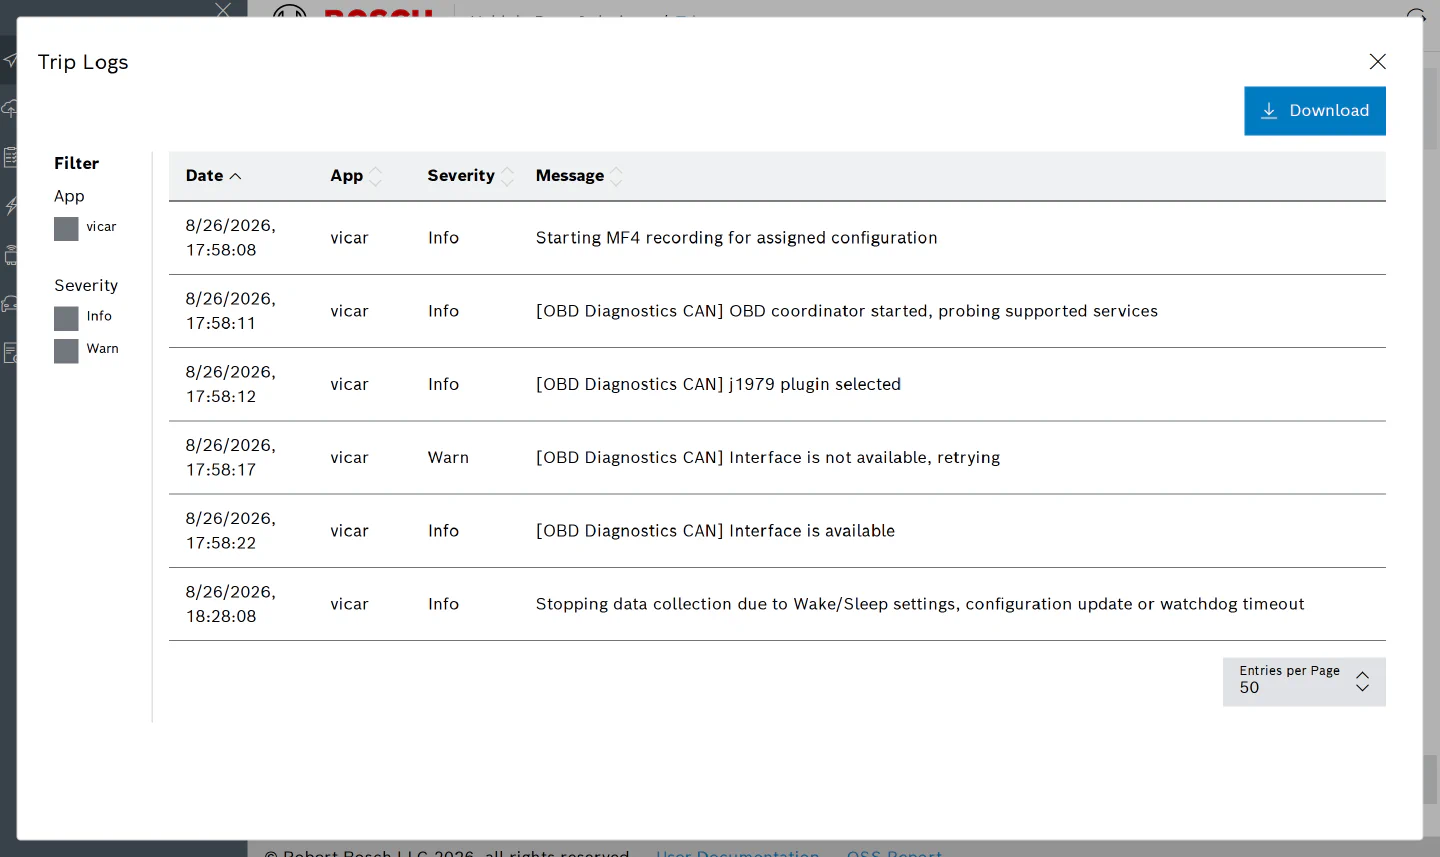
The trip log lists every status message of the logger during the trip with its date, the reporting App (for example vicar, the measurement service), a Severity of Info, Warn or Error and the Message. Filter by app and severity on the left; Download saves the log. Messages that concern one channel start with the channel name in brackets, such as [OBD Diagnostics CAN], so you can tell which part of the configuration they refer to. The Trip Log Messages page explains the messages you are most likely to see.
Grafana
The dropdown at the top lists the Grafana dashboards of your project. Pick one, then use the Go to dashboards button of a trip to open it for that trip, or click Grafana to open Grafana itself. File Browser opens the file browser of the project, where every uploaded file of every trip can be browsed and downloaded.
AutoPlot
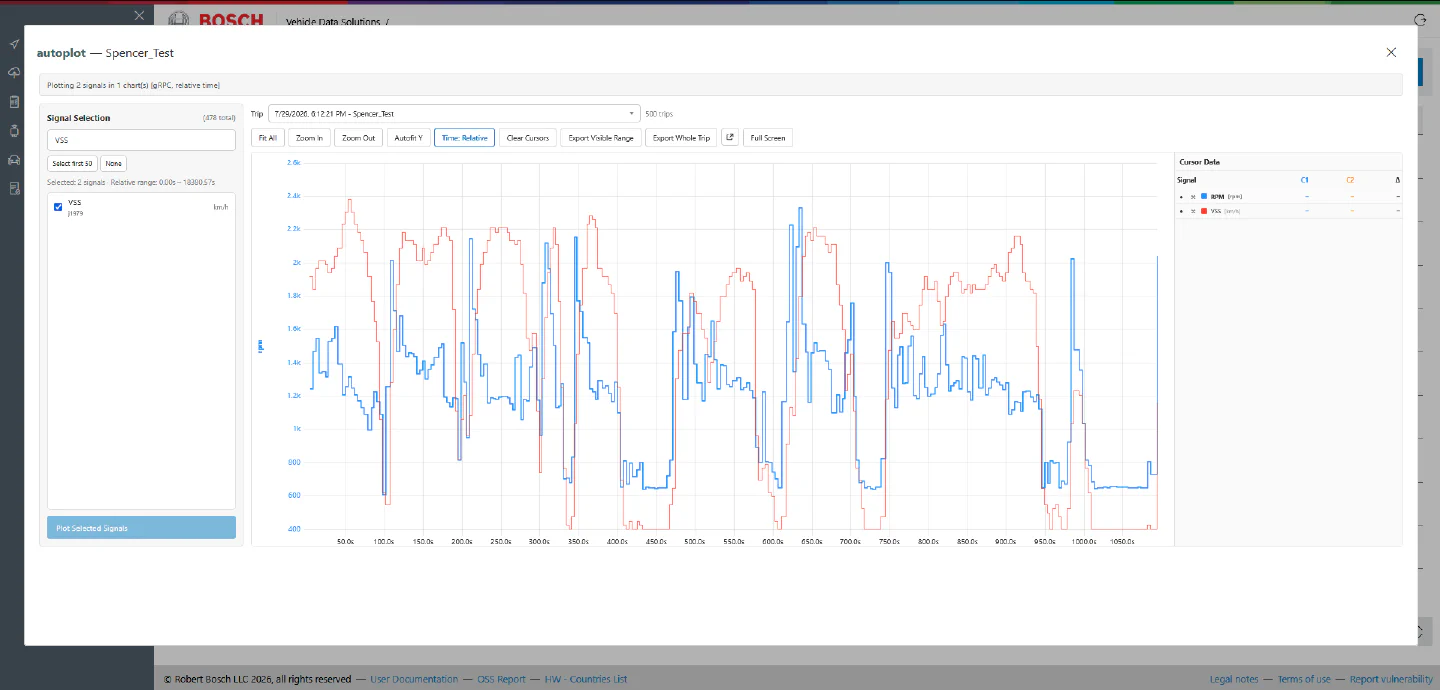
Plot signals opens AutoPlot, an oscilloscope-style viewer for the signals of one trip. Pick signals, zoom into the time axis, and export the selected signals to an MF4 file for further analysis. AutoPlot reads the trip’s data directly from the datasource server, so it is available for every trip with telemetry, independent of Grafana.
Trip Files
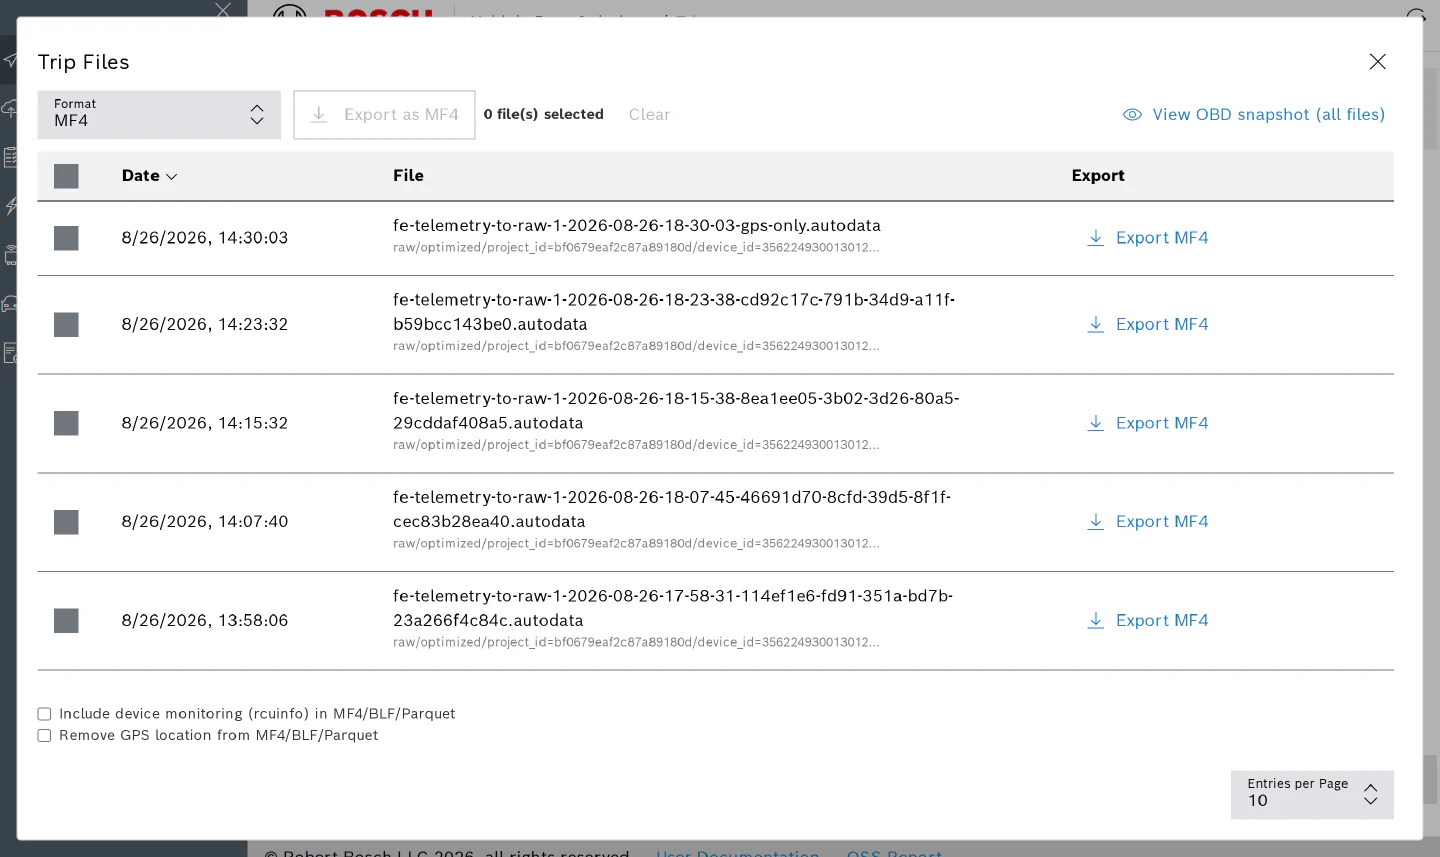
Everything a logger records is uploaded in chunks of the VDS raw format (.autodata), plus any MF4 files it wrote on the device. The Trip Files dialog, opened with the folder button of a trip on the Trip Data page, lists those files and converts them on download.
Formats
Choose the format once in the Format picker; every export in the dialog then uses it:
- Raw (no conversion): the
.autodatachunk as uploaded. - MF4: an ASAM MDF 4 measurement file. Its metadata carries the trip, device, vehicle, configuration and the vehicle’s attributes such as the VIN.
- Parquet: a columnar file for analysis tools.
- BLF: a Vector binary logging file of the CAN traffic.
- OBD Snapshot and OBD Snapshot (JSON): a report of the OBD data in the file, as HTML or JSON; see below.
Two options apply to MF4, BLF and Parquet exports:
- Include device monitoring (rcuinfo) adds the logger’s own health signals to the file.
- Remove GPS location strips the position channels. The raw file keeps them; to keep GPS out of the files recorded on the device in the first place, use Exclude GPS from MDF in the configuration.
Export
Click Export in a row to download that file in the chosen format. To download several, tick their rows (the header checkbox selects the current page) and click Export as …; the dialog shows how many files are selected and, when done, how many succeeded. Bulk exports run at most four conversions at a time.
Conversions happen on demand, so a large chunk takes a few seconds before the download starts.
OBD Snapshot
Trips recorded with OBD (J1979 or J1979-2) can be summarised as an OBD Snapshot: the newest reading of every parameter, plus fault codes, freeze frames, monitor readiness and test results. Select OBD Snapshot or OBD Snapshot (JSON) in the Format picker.
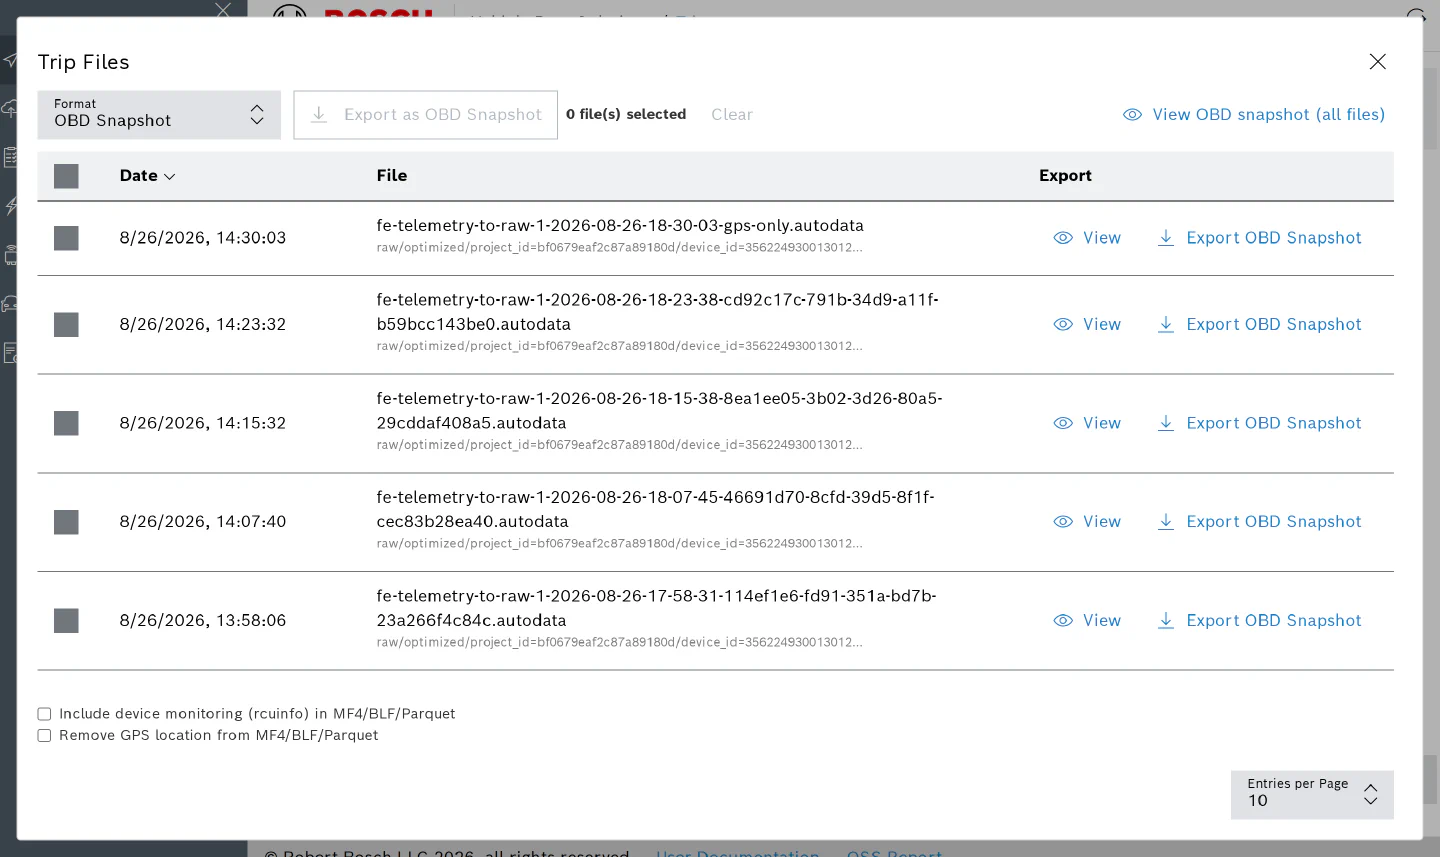
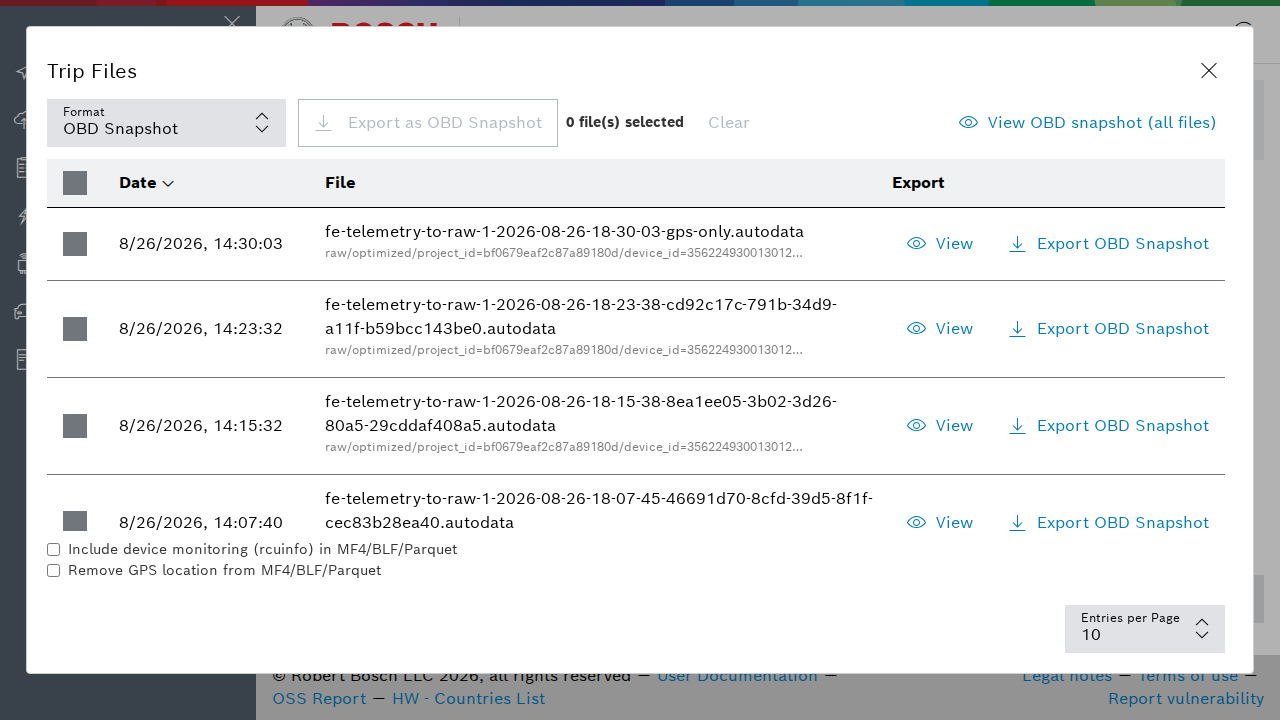
Click View on a file to open its snapshot in the application, or View OBD snapshot (all files) to merge every chunk of the trip into one snapshot. Files that hold no OBD data are skipped and counted.
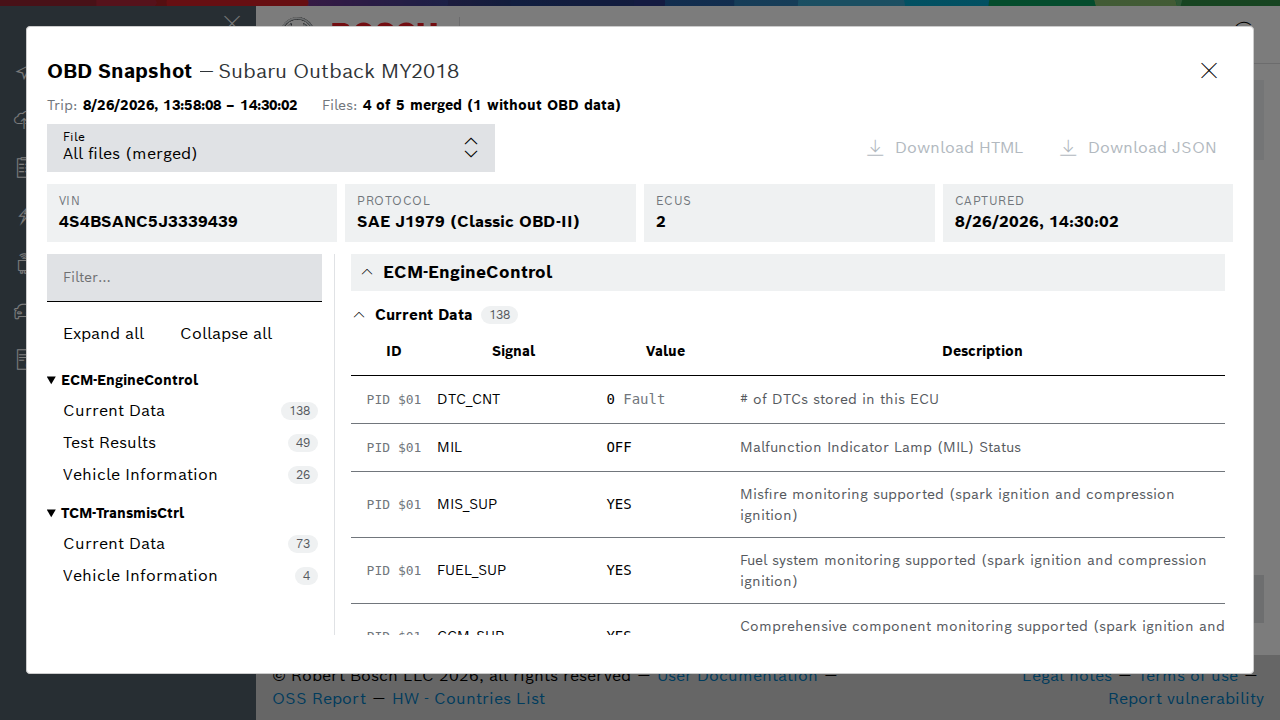
- The viewer lists each ECU and its sections on the left; type in the filter box to narrow the report to a signal name, fault code or description. Expand all and Collapse all open or close every section.
- Download HTML and Download JSON save the report of the file being shown. In the merged view, pick a single file from the File selector first.