Device Web Manager (vdswebmgr)
The owa5X data logger includes a built-in web management interface called vdswebmgr. It provides a local browser-based UI for monitoring and configuring certain device specific configuration options over an Ethernet connection.
192.168.10.1:80 by default. Ensure your laptop’s Ethernet adapter is configured with a static IP on the 192.168.10.x subnet before proceeding.
Accessing the Web UI
- Connect an Ethernet cable directly between your laptop and the device’s Ethernet port.
- Configure your laptop’s Ethernet adapter with a static IP address in the
192.168.10.xsubnet (e.g.192.168.10.2, subnet mask255.255.255.0). - Open a browser and navigate to: http://192.168.10.1
- You will be prompted for credentials. The defaults are:
- Username:
admin - Password:
vds_temppwd
- Username:
Navigation
The web UI is a single-page application. All sections are accessible from the top navigation bar:

| Tab | Purpose |
|---|---|
| Dashboard | System health — CPU, RAM, storage, service status |
| CAN Interfaces | CAN bus statistics, live traffic capture, baudrate detection |
| Networks (Wi-Fi, GSM, Ethernet) | Connections, access point, Wi-Fi, cellular, Ethernet, packet capture, ping |
| Logs | Live service logs and debug snapshot bundles |
| Power Management | Sleep/wake timing and low-voltage protection settings |
| Device Configuration (configctl) | GPS reporting error and the CAN interface GPS is published on |
| Files | Browse and download measurement, config, and corebuffer files |
| Digital IO | Read digital/analog inputs, control digital outputs |
| Settings | Web UI credentials and bind address; saving restarts the web server |
Dashboard
The Dashboard tab provides a real-time overview of device health. It refreshes automatically every 5 seconds.
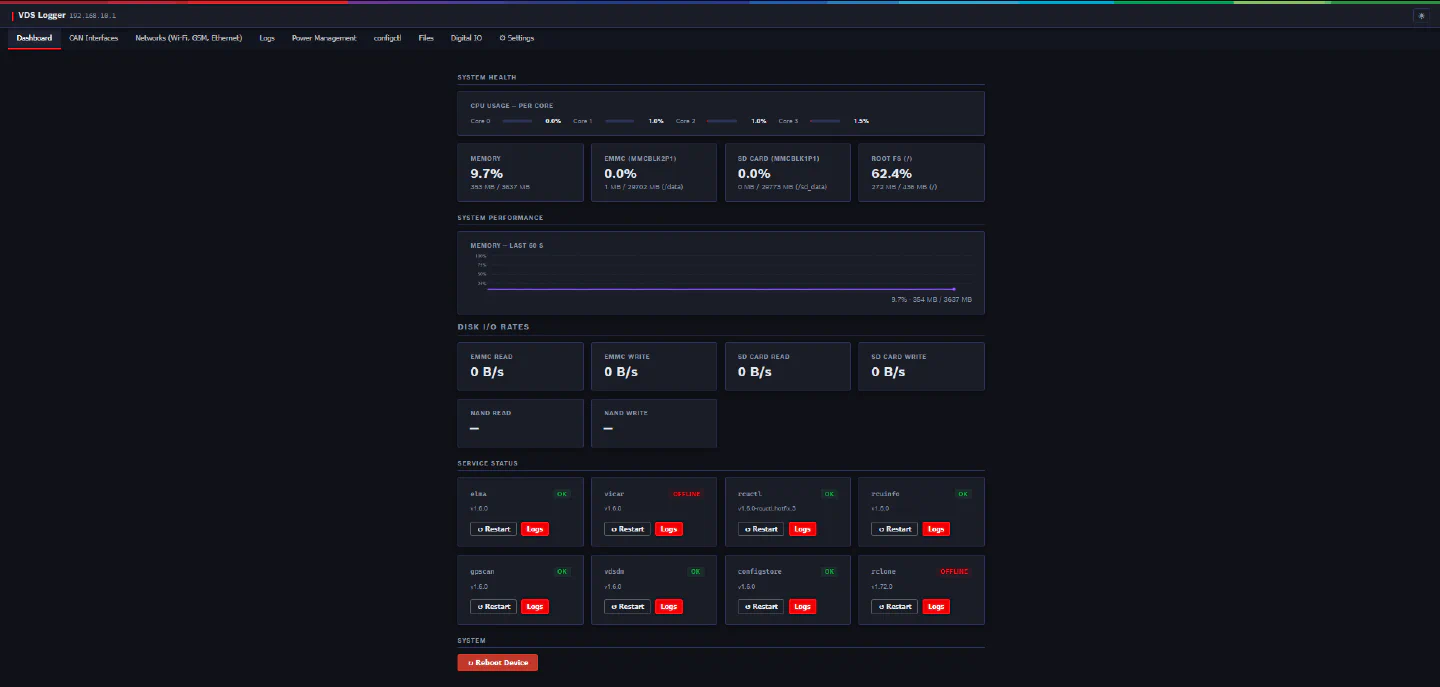
CPU Usage
Per-core CPU utilisation is shown as a bar graph. This matches the values you would see in htop on the device.
Memory Current RAM usage is displayed as a percentage and in megabytes.
Storage Storage usage is shown for three locations:
- eMMC — internal flash storage (primary storage)
- SD Card — removable SD card (if present)
- Root FS — root filesystem partition
Service Status Eight key services are shown as status badges:
| Badge colour | Meaning |
|---|---|
| Green (ok) | Service is running |
| Amber (warn) | Service is degraded or in a transitional state |
| Red (err) | Service has failed or is not active |
| Grey (unknown) | Service status could not be determined |
The installed package version for each service is shown below its badge. Note is normal for “rclone” to be “offline” as the service runs on a 5 minute timer to upload locally recorded MF4s.
Reboot Device The “Reboot” button triggers a graceful system reboot.
CAN Interfaces
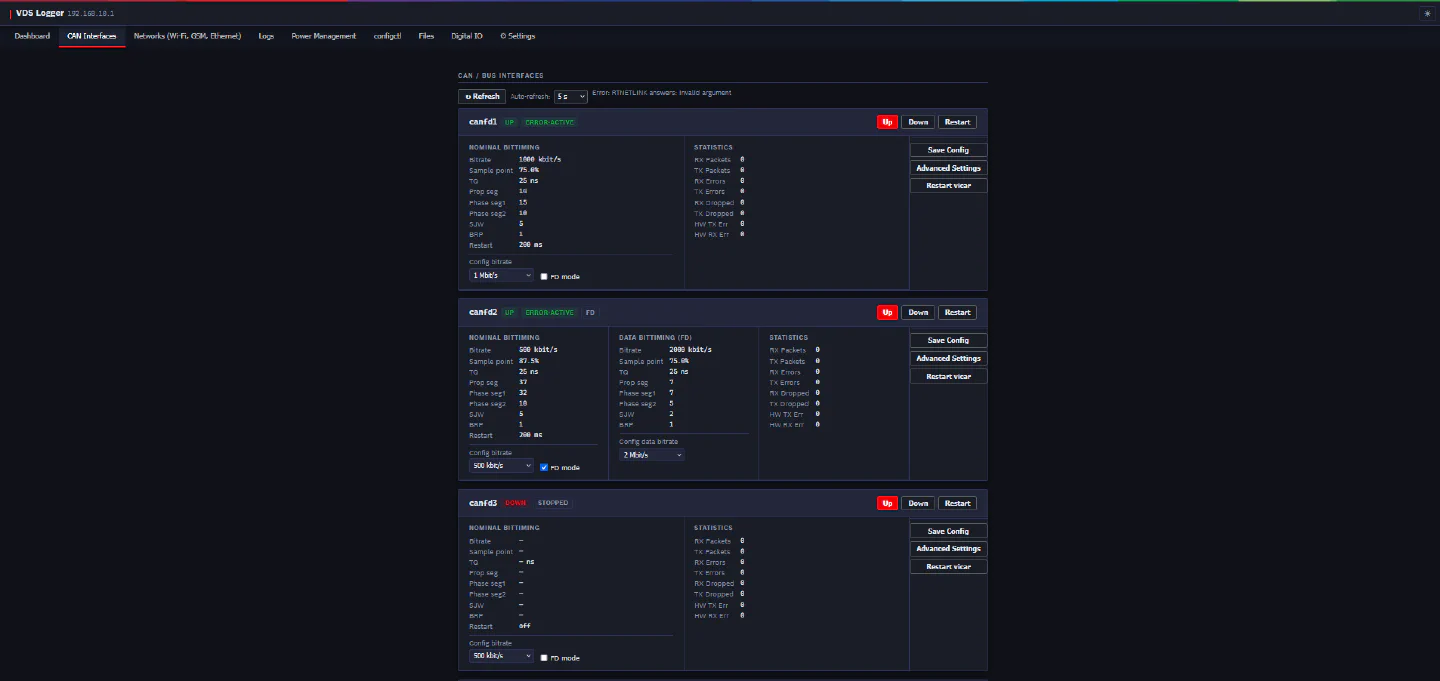
The CAN Interfaces tab shows live statistics for all CAN interfaces detected on the device, and provides tools for traffic capture and bus diagnostics.
Interface Cards
Each CAN interface (e.g. can0, can1, canfdX) has its own card displaying:
- Current link state (up / down)
- Configured bitrate and timing parameters
- RX / TX frame counters
- Bus error counters (bus-off, error-passive, error-warning)
Buttons on each card let you bring the interface Up, take it Down, or Restart it.
Modifying CAN Bitrate / Saving Config
To change the bit rate of an interface, pick it in the Config bitrate dropdown on the interface’s card and click Save Config.
vicar from the service dropdown, or from the Dashboard using the vicar service badge restart button.
Live Candump (Traffic Capture)
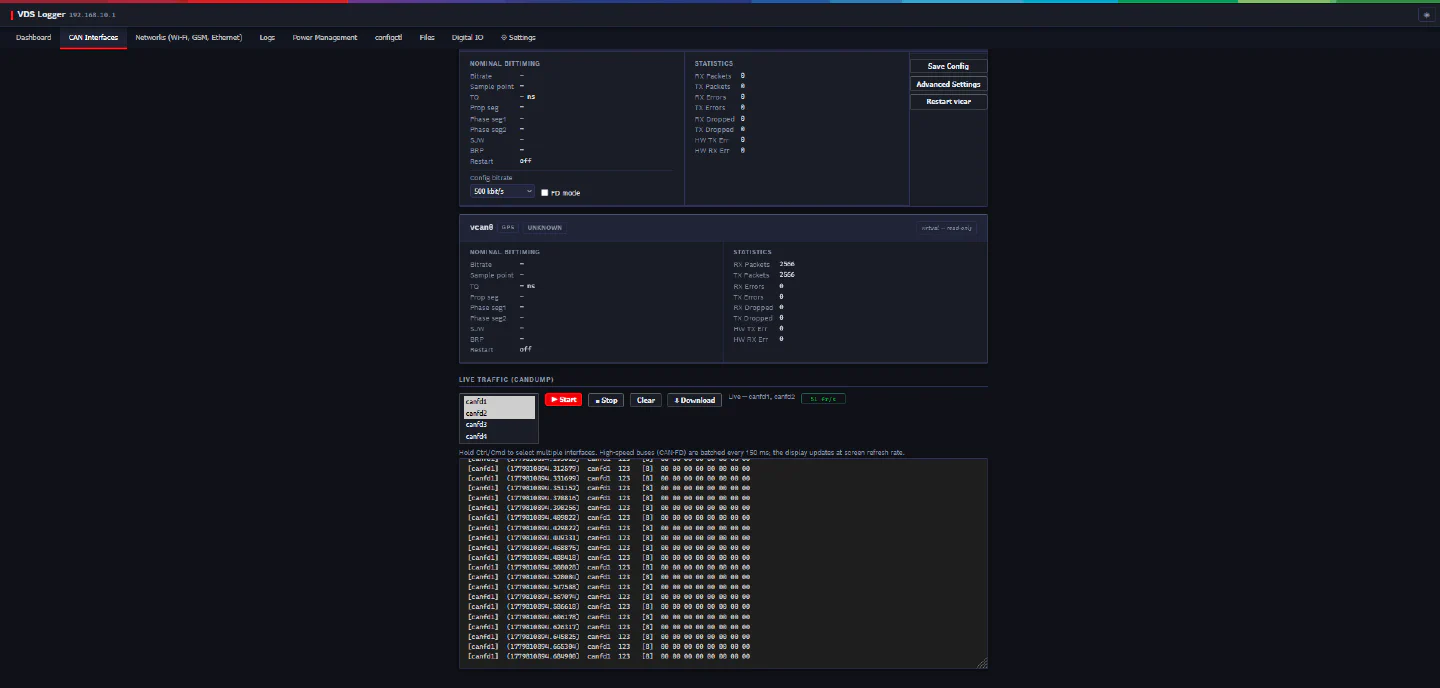
A live scrolling terminal shows raw CAN frame output from one or more interfaces simultaneously using candump. You can:
- Select which interface(s) to capture from using the interface selector.
- Start and stop the stream independently for each interface.
- Capture output is capped at ~2,000 lines.
Advanced: Baudrate Detection
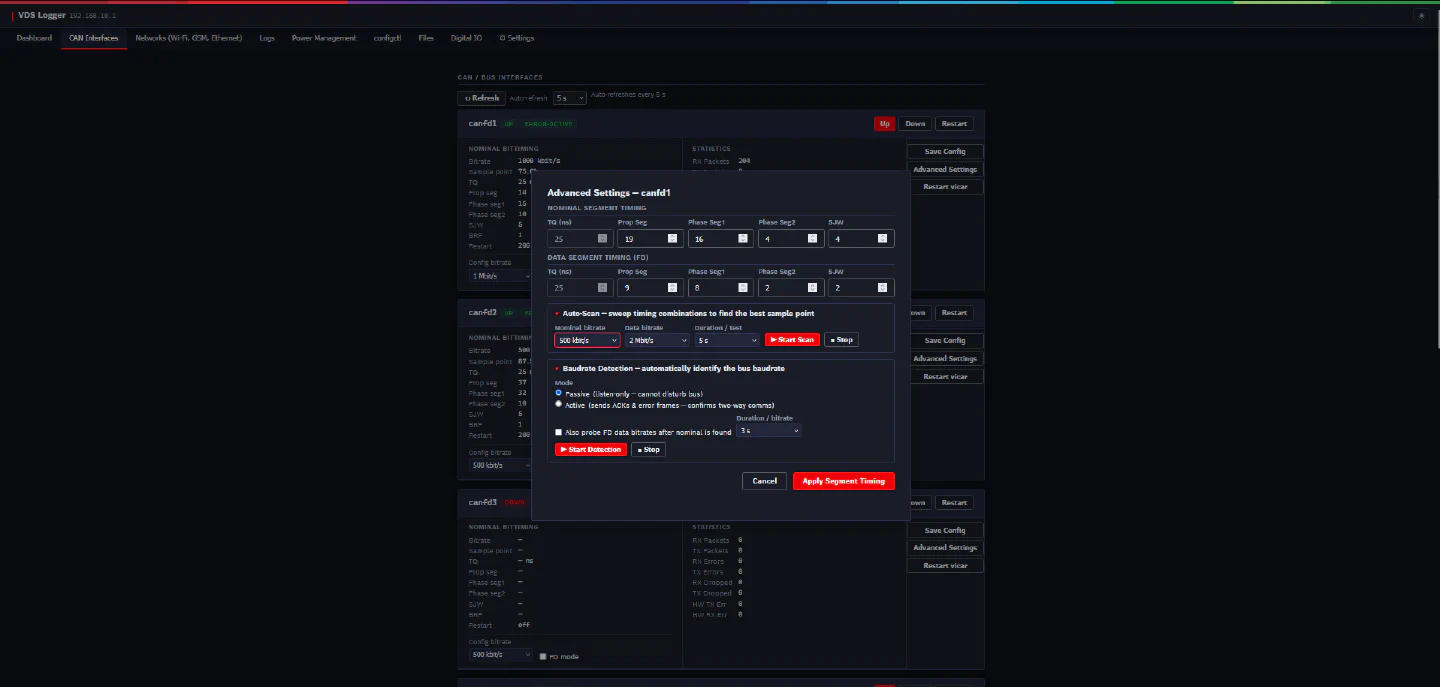
The Detect Baudrate tool performs a passive (or active) sweep of standard CAN bitrates to identify the bitrate in use on a connected bus.
- Mode:
passive(listen only, does not transmit) oractive(transmits ACKs — only use if no other node is present). - FD: Enable to also probe CAN FD data bitrates.
- Duration per step: 1, 3, 5 or 10 seconds (default 3 s). The timing scan uses 1, 2, 5 or 10 seconds (default 5 s).
passive mode when the bus has live traffic from a vehicle or ECU. Active mode can cause Bus interruption and interference - use with caution.
Advanced: Timing Scan
The Timing Scan tool sweeps segment-timing combinations at a fixed nominal bitrate to find settings that produce a clean bus — useful when a non-standard bitrate or unusual sample-point configuration is in use.
Networks
The Networks tab manages all network connectivity on the device, including Ethernet, Wi-Fi, cellular, and access point (hotspot) settings.
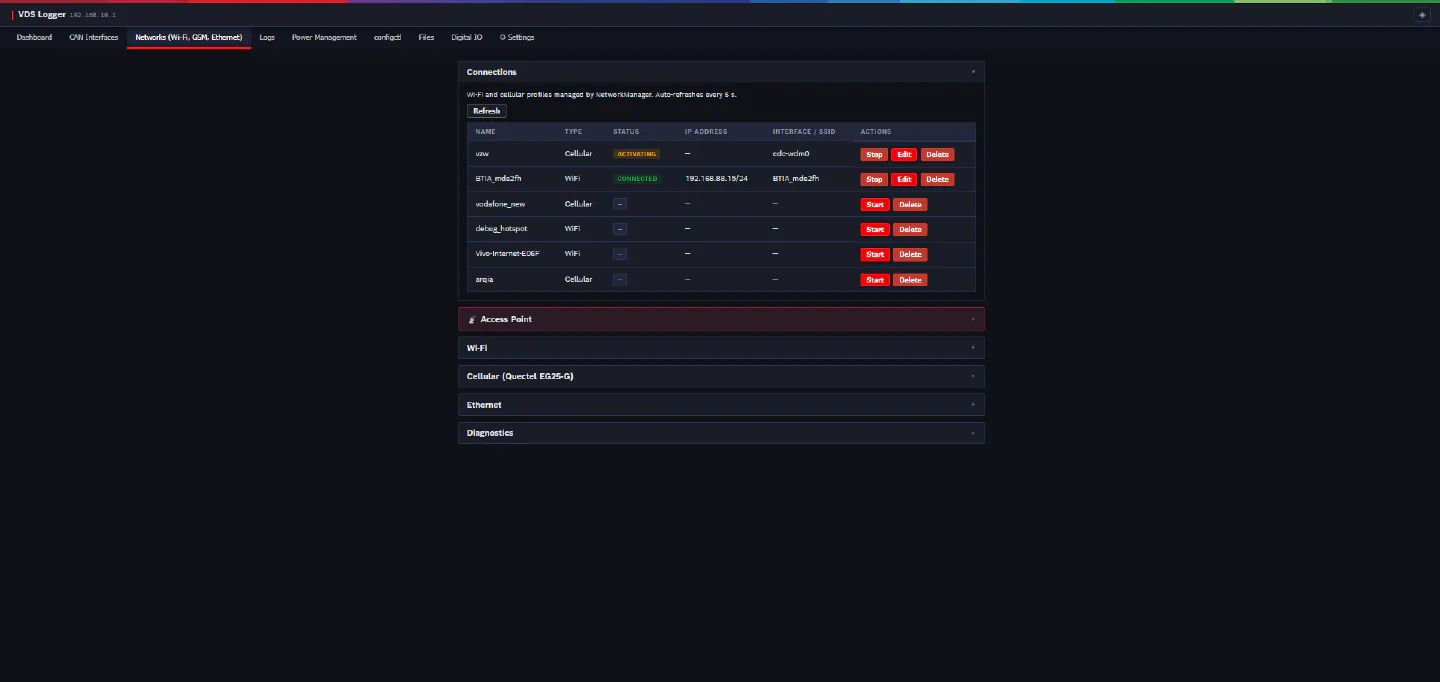
Active Connections
A table lists all currently active NetworkManager connections, showing:
- Connection name, type, device, and IP address
- Per-row actions: Stop, Edit, Delete
Active connections auto-refresh every 5 seconds while this tab is open.
Connections
The Connections table lists every saved network profile, active or not. Activate brings a profile up, Edit opens its IPv4 settings (method, address, prefix, gateway, DNS, MTU and route metric) and Delete removes it.
Editing a Connection
Clicking Edit on an active or saved connection opens a modal where you can change:
- IPv4 method (DHCP / static)
- IP address and prefix length
- Gateway
- DNS servers
- MTU
- Route metric
Changes take effect on the next reconnect (or when you manually activate the profile).
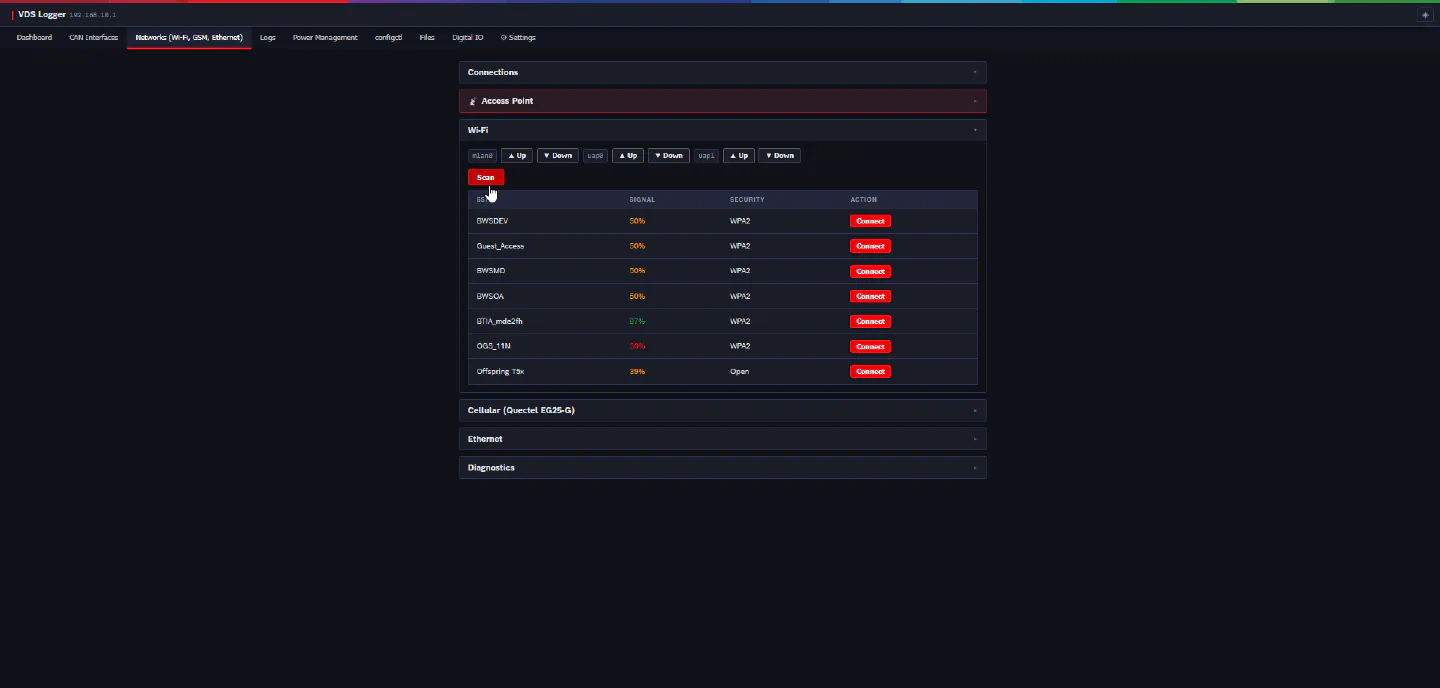
Wi-Fi
Click Scan to trigger a Wi-Fi scan. Results appear in a table showing SSID, signal strength, and security type. Click a network row to enter the password and connect.
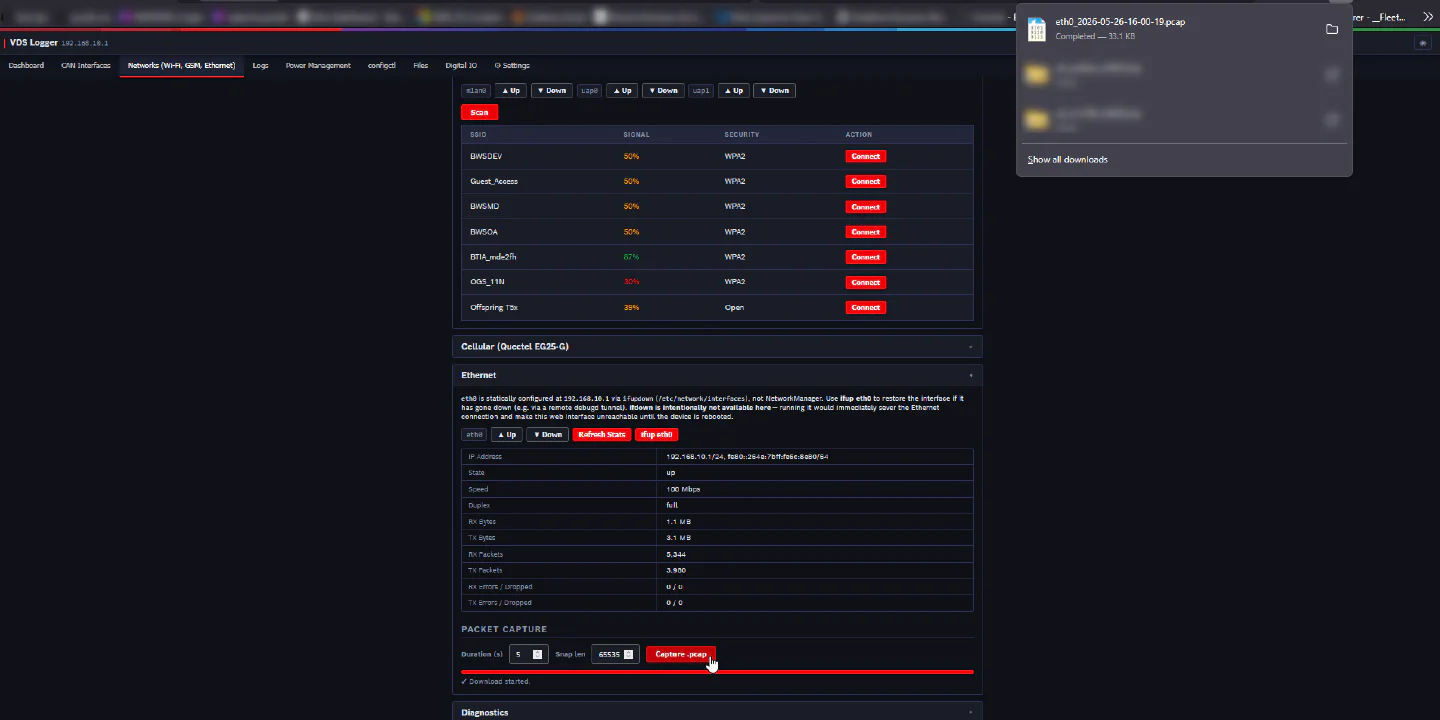
Ethernet Stats (eth0)
A table displays low-level counters read from the kernel sysfs for eth0:
- RX / TX bytes, packets, errors, dropped frames
- Current link state
Packet Capture
Capture live network traffic on eth0 and download it as a .pcap file for analysis in Wireshark or similar tools.
- Capture duration: 1–120 seconds
- Snap length: 64–65535 bytes per packet (default 96, which keeps headers only; use 65535 for full frames)
The progress bar tracks the remaining capture time. The file download starts automatically when the capture completes.
Ping
Enter any hostname or IP address and click Ping to run a 4-packet ICMP test from the device. Results show reachability, packets sent/received, and average round-trip time.
Cellular Status
The Cellular card shows the current state of the LTE modem:
- Modem state (connecting, connected, etc.)
- Signal quality (0–100 %)
- LTE RSRP in dBm (when available)
- Carrier name
- Assigned IP address
Modem Details
Expanded modem information from the modem, including firmware version, IMEI, SIM ICCID, APN, and more.
Access Point
Create a Wi-Fi access point on the device’s wireless interface (uap0 or uap1). This can be used to access this interface over Wi-Fi instead of being “hard-wired”.
Logs
The Logs tab provides live streaming log output from any of the eight managed services, plus a tool for capturing a full debug support snapshot.
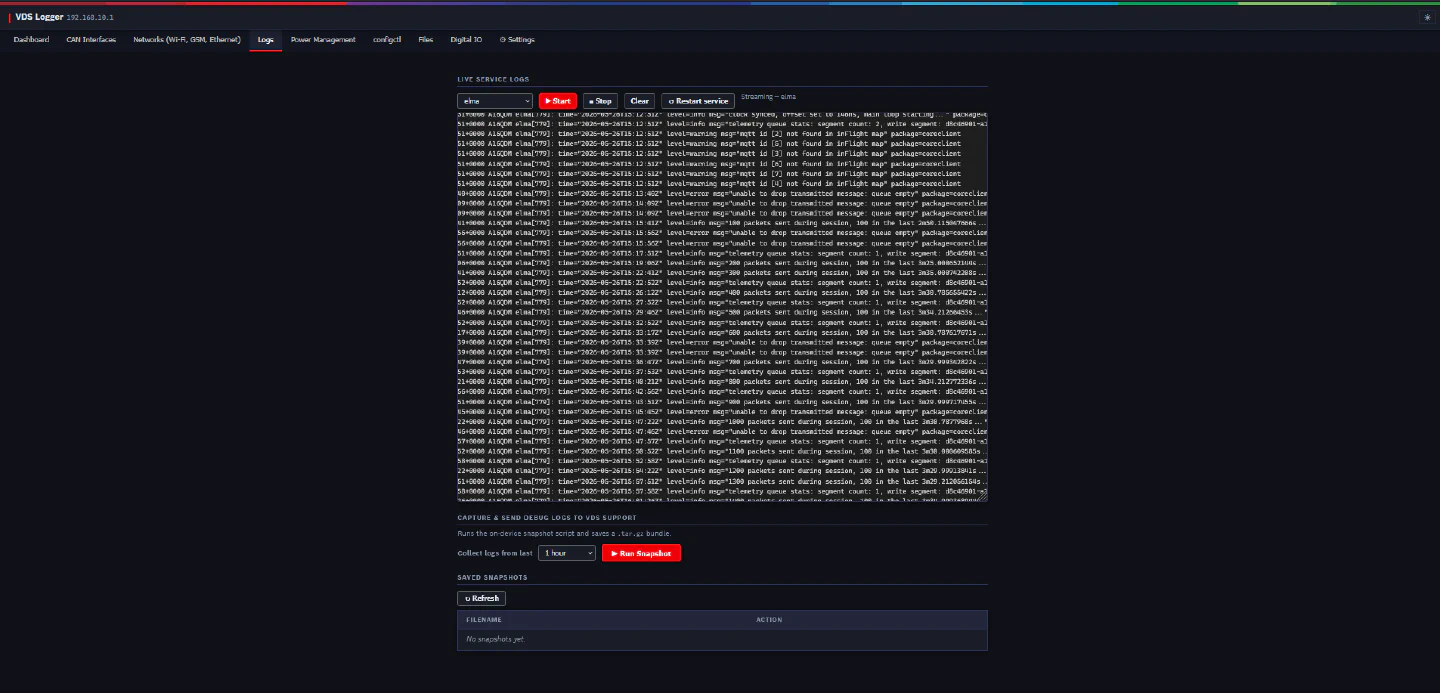
Live Service Logs
Select a service from the dropdown and click Start Stream to begin tailing its log output in real time. The output is capped at approximately 2,000 lines. The stream is stopped automatically if you navigate away from this tab.
| Service | Description |
|---|---|
elma |
Main device daemon. Device side agent responsible for connecting the device to the AWS cloud — manages data collection, upload, clock sync, etc. |
vicar |
Vehicle data acquisition service. Manages CAN bus, XCP/CCP, UDS, OBD, and MDF4 recording. |
vdsdm |
Provisioning and OTA agent. Handles FOTA updates and package installation, and certificate management. Communicates with the on-device TPM for certifiying the connection of the device to the VDS applicaton / to AWS |
configstore |
On-device configuration server. Stores device specific dynamic configs and makes them available to other services |
rcuctl |
Hardware abstraction layer (HAL). Handles power management, LEDs, GPS/Wi-Fi/GSM control, CAN wake detection, and firewall. |
rcuinfo |
System metrics collector. Reports CPU, memory, disk, uptime, runtime and network stats. |
gpscan |
GPS → CAN bridge. Reads position data from the GPS and forwards it as CAN frames. Outputs the GPS data onto a virtual CAN (vcan0) However, it can be configured to dump the GPS data from the device onto a physical CAN |
rclone |
File sync service. Used for transferring measurements to the cloud. |
ModemManager |
System service managing the LTE modem — handles SIM, bearer, and signal state. |
NetworkManager |
System network management — controls Wi-Fi, and cellular connection profiles. |
Debug Snapshot
The Debug Snapshot tool runs a comprehensive diagnostic collection script on the device and streams its progress in real time. The resulting archive (.tar.gz) is saved on the device and a download link is provided when complete.
The snapshot collects:
- kernel ring buffer
- Log output per service and combined
- CAN interface details
- Modem status
- Network status
- Disk usage
- 5-second candump capture per CAN interface
Use the Since dropdown to control how far back in time logs are collected (e.g. 1 hour ago, 1 day ago).
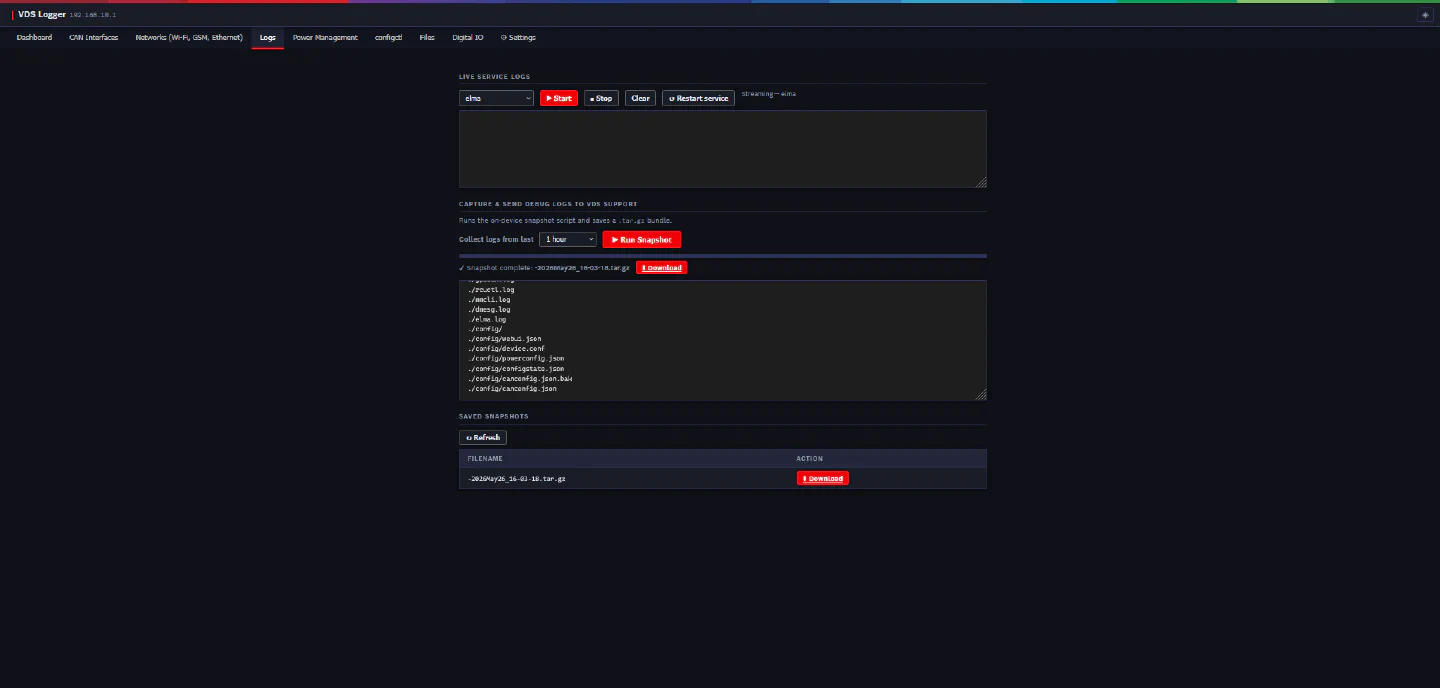
Snapshot Archive List
Previously captured snapshots are listed in a table. Click the filename to download any archive.
Power Management
The Power Management tab provides a structured form editor for the device’s powerconfig.json. Changes are saved atomically with a .bak backup.
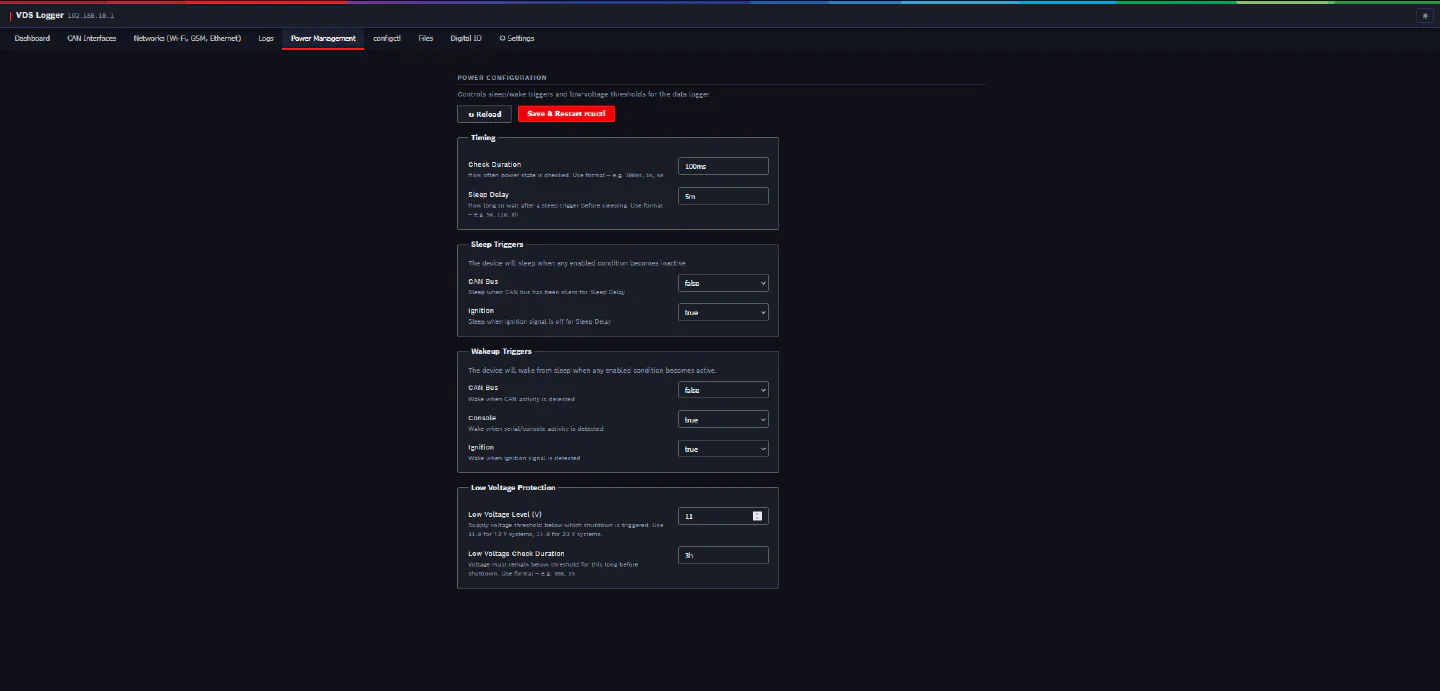
The form is divided into sections:
Timing The Check Duration (how long the sleep conditions must hold) and the Sleep Delay before the device goes to sleep.
Sleep Triggers Which conditions send the device to sleep: no CAN bus activity, ignition (T-15) off.
Wakeup Triggers Which events wake it up: CAN bus activity, the console, ignition (T-15) on.
Low Voltage Protection The voltage thresholds at which the device shuts down to protect the vehicle battery.
The button reads Save & Restart rcuctl: saving restarts the power management service after a confirmation, so the new settings apply immediately.
powerconfig.json.bak.
configctl (GPS Configuration)
The configctl tab reads and updates the GPS reporting configuration on the device using the configctl CLI tool.
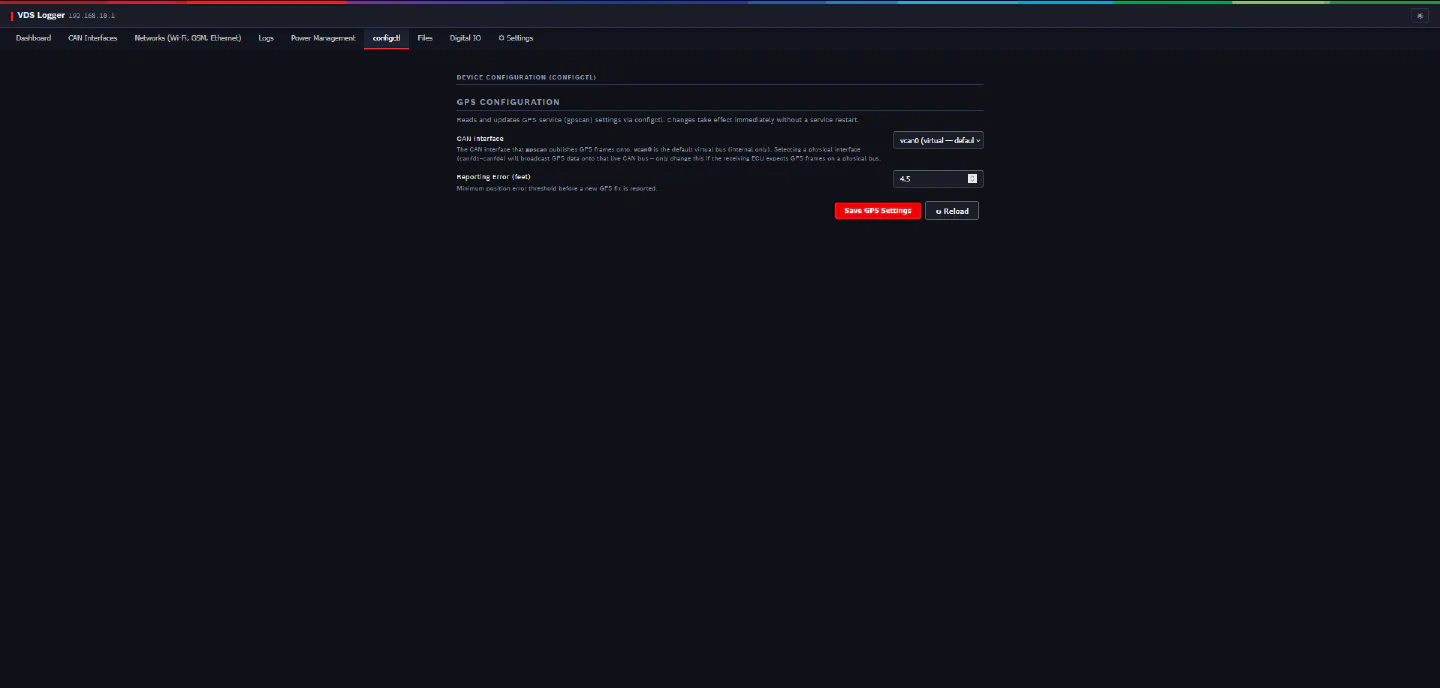
Reading the current GPS configuration The current GPS settings are displayed when you open this tab.
Updating GPS Reporting Error
Enter a new Reporting Error value (in feet) and click Save GPS Settings. The page stores it through configctl, the device’s configuration tool.
CAN Interface
The interface GPS positions are published on. The default vcan0 is a virtual interface that only the logger itself reads. Selecting a physical interface (canfd1 to canfd4) broadcasts the GPS frames on that vehicle bus, so leave it at vcan0 unless the vehicle is meant to receive them.
Files
The Files tab is a read-only file browser scoped to three directories on the device. It allows you to browse directory trees and download individual files.
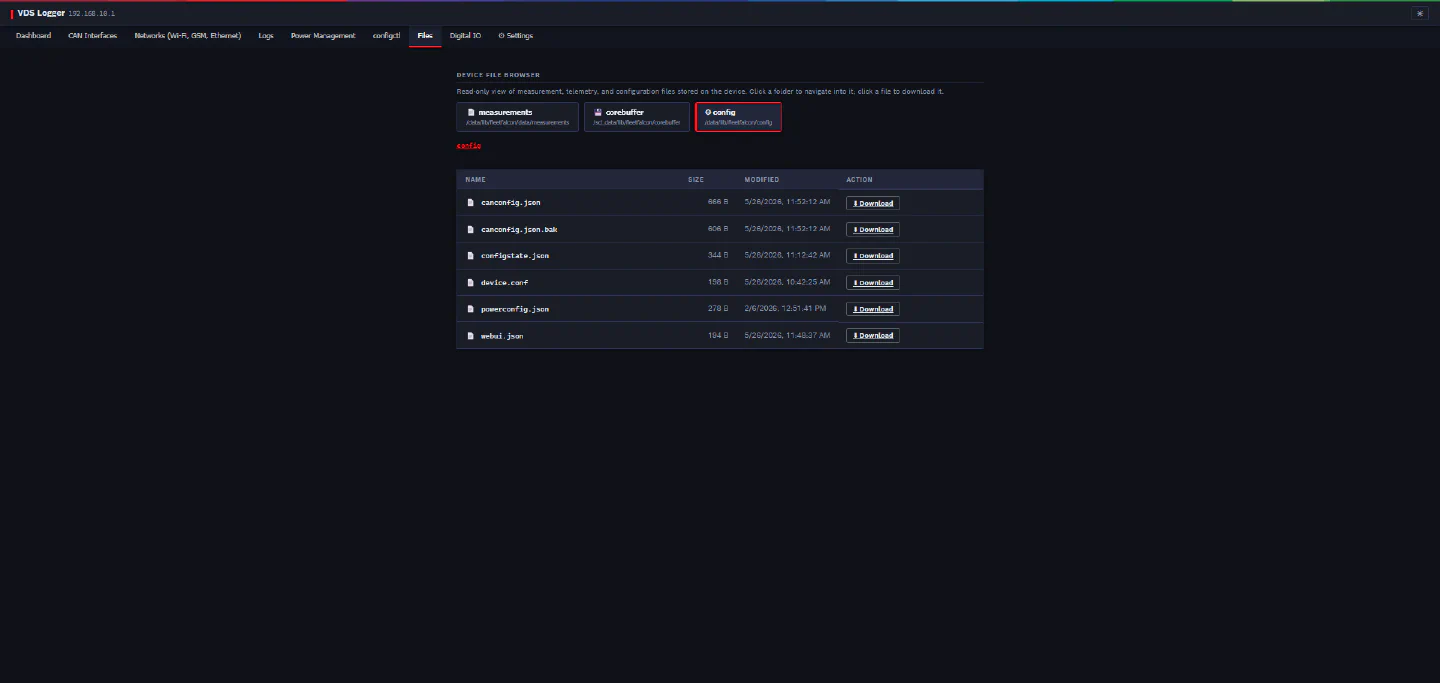
The three root directories available are:
| Root | Default path | Contents |
|---|---|---|
measurements |
/data/lib/fleetfalcon/data/measurements/ |
Recorded MDF4 / raw measurement files |
corebuffer |
/sd_data/lib/fleetfalcon/corebuffer/ (SD card) |
Device telemetry binary files |
config |
the configuration directory reported by configctl |
Configuration JSON files |
The first two paths are the defaults; the page resolves the actual directories from the device’s configuration when it opens.
Click a folder to navigate into it. Click a filename to download that file.
Digital IO
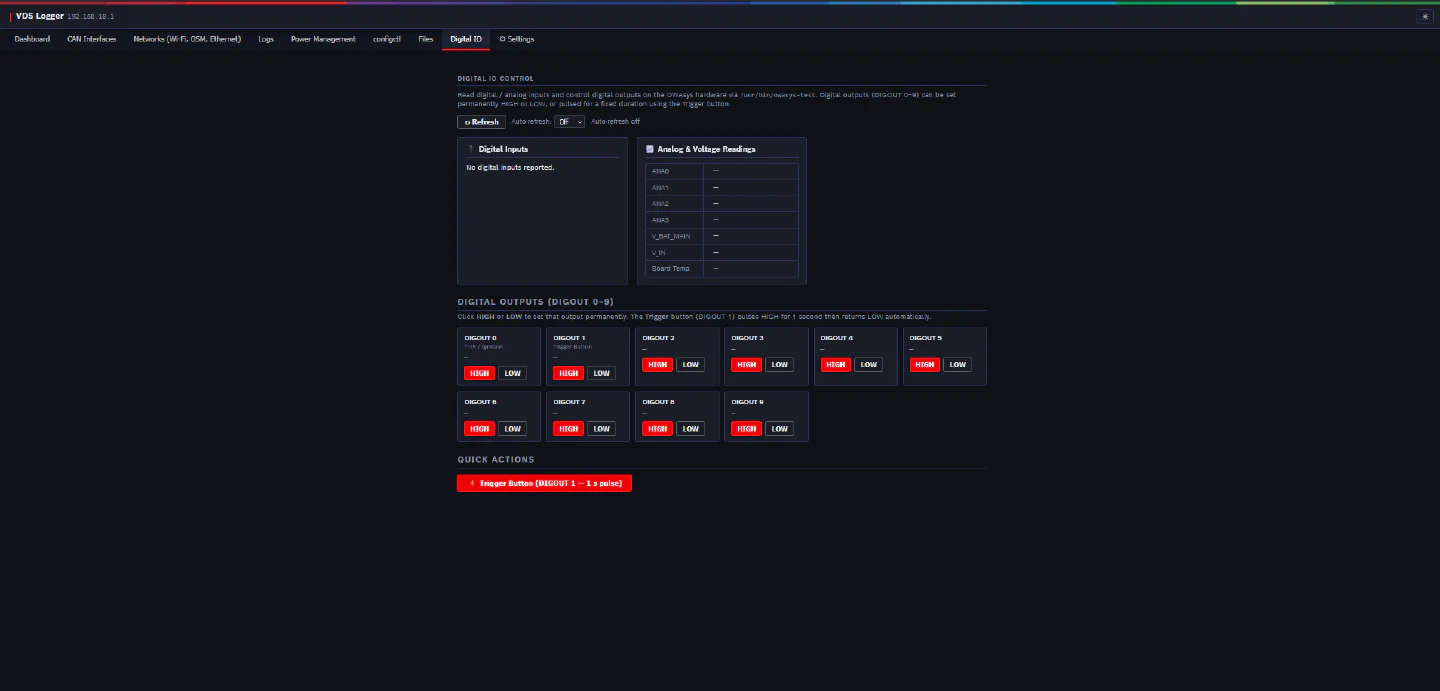
The Digital IO tab reads and controls the OWAsys hardware digital and analog I/O pins via the owasys-test utility.
Inputs (read-only)
The following values are refreshed automatically while this tab is open:
| Type | Channels | Description |
|---|---|---|
| Digital Inputs | DIN0 – DIN7 | Discrete high/low logic level |
| Analog Inputs | ANA0 – ANA3 | Raw ADC reading |
| Battery voltage | vbat_main |
Main battery supply voltage |
| Input voltage | v_in |
Device input supply voltage |
| Board temperature | BOARD_TMP |
Internal PCB temperature sensor |
Digital Outputs (DIGOUT)
Each DIGOUT pin (0–9) has HIGH and LOW buttons that set it immediately.
Trigger Pulse The Trigger Button (DIGOUT 1 — 1 s pulse) under Quick Actions pulses DIGOUT 1 high for one second and returns it to low, which is useful for testing wiring or triggering an external device. Other pins and durations (1–10,000 ms) are available through the device’s HTTP API.
Settings
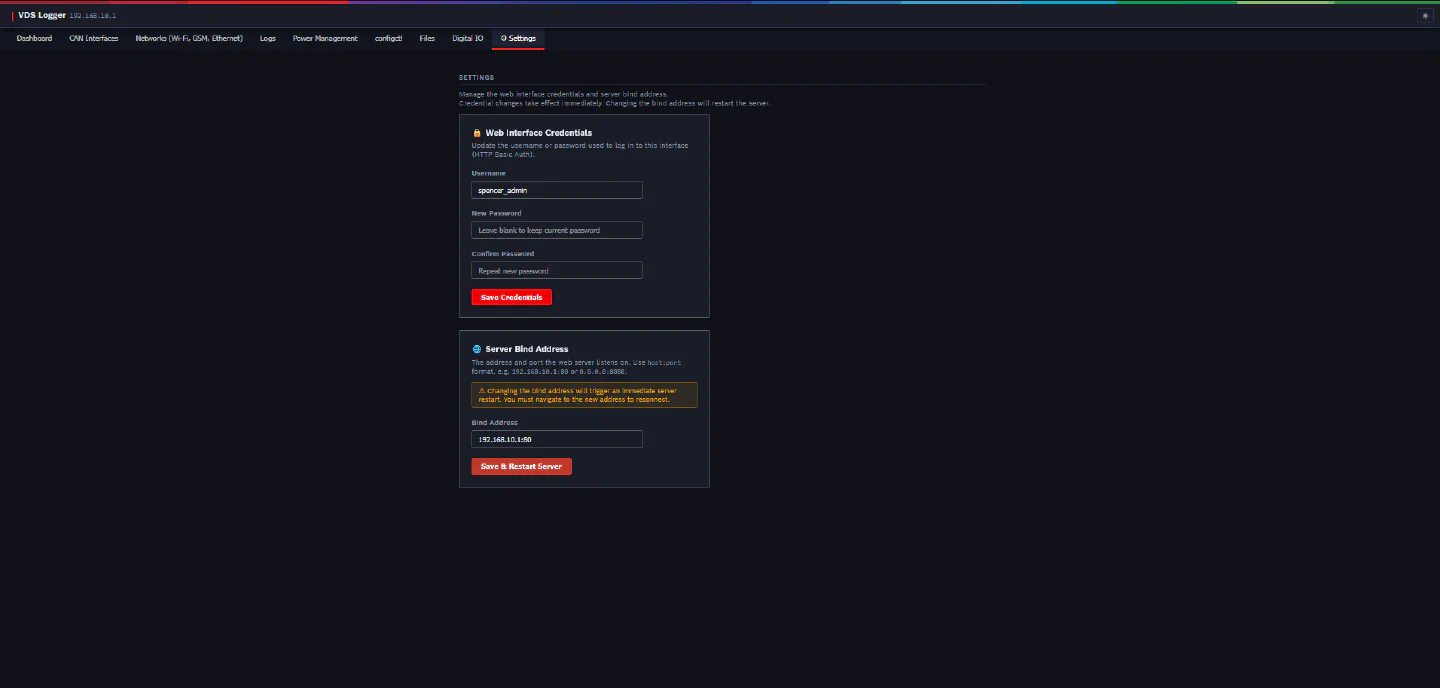
The Settings tab manages web UI access credentials and the server’s listen address.
Changing Credentials
Enter a new username and password (confirmed in the second field) and click Save Credentials. The new credentials take effect immediately on the next request — no service restart is needed.
Changing the Bind Address
The server’s listen address can be changed if you need the web UI accessible on a different interface or port due to conflicts with other devices on the local network. Enter the new address in <ip>:<port> format and click Save Bind Address.